f. Analysis Mode Overview (US Options & Futures)
Analysis Mode Overview (Profit & Loss Graph)
Are you looking to analyse your positions by having a visual representation rather than crunch numbers in your head? If so, welcome to the Analysis Mode on the USOF trading platform. Here, you can analyse existing positions in your portfolio or any trade idea before sending it. Check out the rest of this article for more details.
Analysis Mode Location and Access
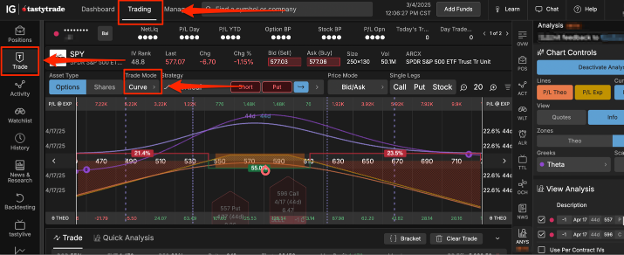
To use Analysis Mode, navigate to the 'Trading' tab on the top left of your screen.
Click the Trade tab, located in between the positions and activity tabs. Once inside the Trade tab, select "Curve" to enter Analysis Mode.
Analysis mode location
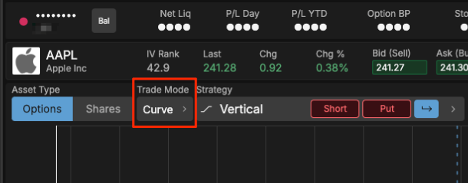
Analysis Mode may be toggled on or off by clicking on the 'Trade Mode' button within the trade tab.
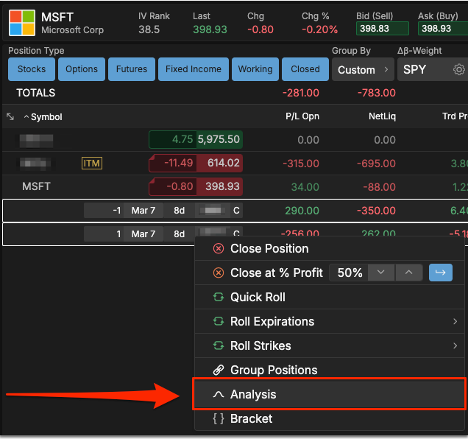
You can also open the analysis tab on existing positions within the positions tab. Left click on the position or future strategy ideas you want to analyse and then right click to open a quick action menu. Click on Analysis in the quick action menu and the analysis mode will populate.
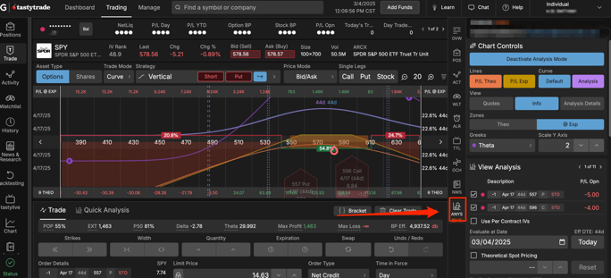
Additionally, you can quickly open up the analysis mode on the platform's active symbol by clicking on the View Analysis button in the right-hand panel.
Analysis Mode Layout Overview
The Analysis Mode is comprised of two parts: the platform Analysis Mode curve view and the Analysis Control tab. In this example, we will be using a 30∆ SPY April monthly expiration strangle as an example to illustrate the features of Analysis mode.
There's a lot to look at when using the Analysis Mode, which is why we have broken it up for you.
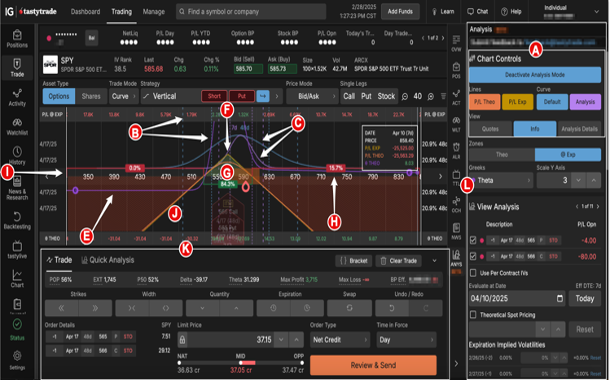
A. Viewing Options
B. 1 & 2 Standard Deviation Line (Blue = Current, Violet = Theoretical)
C. Bell curve (Blue = Current, Violet = Theoretical)
D. Cursor info box
E. Theoretical greek line (delta, gamma, theta, vega, rho)
F. Profit/loss line at expiration
G. Profit/Loss Zone
H. Price range probability (based on variables, if applied)
I. Zero line
J. Theoretical profit/loss line
K. Order ticket
L. Analysis Controls (inside right-hand sidebar)
Viewing Options
Located on the right-hand side panel of Analysis Mode, this area allows you to customize what you are viewing inside the Analysis curve.
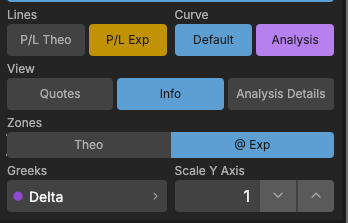
Lines
P/L THEO: Theoretical profit/loss line illustrates the position's theoretical profit and loss based on any variables (if applied) in the Analysis Control tab. This line can change shape based on the variables applied. This metric is best-suited when looking out into the future or applying any variables into the Analysis Controls. P/L Theo is an analysis tool and may not directly reflect your P/L Open.
P/L EXP: Expiration profit/loss line illustrates the potential gain or loss from a position at expiration. This line will remain static. The breakeven point is shown as this line converges with the zero line.
Greek dropdown menu: Illustrates the change in delta, gamma, theta, vega, or rho based on any variables (if applied) in the Analysis Control window. The slope of this line changes based on the variables applied.
Curve
DEFAULT: Default is a bell curve based on the options expiration current condition. Standard deviation lines will also appear.
ANALYSIS: The Analysis bell curve is based on any variables (if applied) in the Analysis Control window. This bell curve will widen if analyzing an expansion in volatility and narrow if volatility declines. Standard deviation lines will also adjust according to the variables applied in the Analysis Control.
Zones
THEO: The theoretical profit/loss zone illustrates a profit or loss based on any variables (if applied) in the Analysis Control tab. For example, if volatility increased, the 30∆ short strangle that was sold would display a red theoretical loss zone below the zero line. On the other hand, if there was a volatility collapsed then a green theoretical profit zone will appear above the zero line.
@ EXP: This will display the profit/loss zone at expiration. This is a fixed zone.
View
QUOTES: Selecting this button will allow you to view the bid and ask of the options series currently selected. The bid prices display below the zero line, and the ask prices appear above the zero line.
INFO: When enabled this will display a cursor menu based on where your cursor is along the curve. The cursor menu will show the options expiration date, underlying price, profit/loss at expiration, theoretical profit/loss, and theoretical greek value. Theoretical data is based on the variables entered in the Analysis Control tab.
Theoretical Values
The P/L @ Expiration bar is located at the top of the Analysis Mode curve.

Theoretical Greek bar, located at the bottom of the Analysis Mode curve. Your selection is based on the selected Greek metric in the Viewing Options.

Order Ticket
When using Analysis Mode, the Analysis Curve will analyse what is on the order ticket. You can also customize which legs you want to analyse within the Analysis Controls tab, which is explained in the next section. For example, if you are analyzing an iron condor, but only want to evaluate the call side, just deselect the put side in the Analysis Controls.
Analysis Controls
Analysis Controls are located in the right-hand sidebar. To access the right-hand sidebar, simple click the small white arrow in the bottom right-hand corner of your screen. The analysis tab is the last icon in the icon list. The Analysis Control is comprised of two areas: Analysis Selection Controls and Analysis Implied Volatilities.
Positions will appear in the following situations:
- Existing positions will auto-populate if the symbol is entered in the symbol field at the top of the platform.
- A populated order ticket.
- Selecting the position(s) from the Positions tab
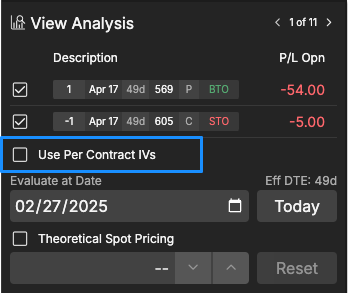
When positions populate in the Analysis Selection Controls area, a checkbox will appear immediately to the left of each position. A checkbox that is marked indicates a position that is being analysed. Furthermore, the uppermost checkbox indicates all positions selected. You can toggle on or off the position(s) you want to analyse by checking (on) or unchecking (off) each box.
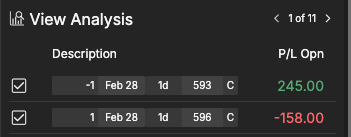
Additionally, you can view different column metrics by clicking the '>' arrow to view other column pages. Columns with a 'Theo' label are dependent upon the variables entered in the Analysis Control tab.
For all you options math nerds out there, theoretical metrics are based on the Black-Scholes Options Pricing Model. When looking at theoretical metrics today, it can be a gauge for "fair pricing" based on our options pricing model. Theoretical metrics are better suited when looking into the future and determining the effects of the position based on time, price, and volatility.
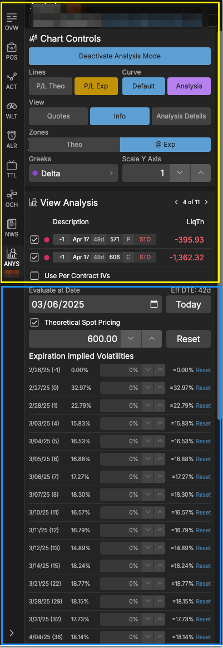
Analyse Implied Volatilities
In this area, you can evaluate and analyse a position by adjusting three independent variables:
- Evaluate At Date
- Theo Spot Price
- Expiration Implied Volatilities
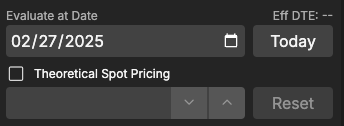
"Evaluate At Date" will allow you to visualize and analyse the effects of time decay. By default, the effective days to expiration, or "Eff DTE," will be the expiration date of the position being analysed.
The "Theo Spot Price" feature lets you analyse and see the results of a position by adjusting the price of an underlying to view the effects of price action of the position analysed. To see the effects of price action, click the checkbox located to the left of "Enable".
Lastly, the Expiration Implied Volatilities allows you to analyse and evaluate a position regarding changes in volatility. Here, the options positions that are populated within the Analysis Selection Controls area will illuminate so volatility metrics may be adjusted for analysis purposes. You can analyse the effects of a volatility expansion by adding to the percentage, or a volatility collapse by subtracting from the position. Figures may be adjusted by using the up or down arrows next to the volatility percentage or manually entering by double-clicking the number. Volatility figures can be reset by clicking the "RESET" button along the right.
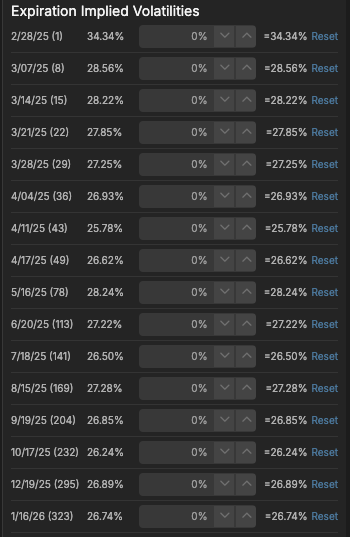
Additionally while analyzing your position or trade, check the Use Per Contract IVs box to view the actual volatility of each strike instead of the volatility of the entire expiration.