EUR/USD, GBP/USD advance while USD/JPY slips on weaker US dollar
Outlook on EUR/USD, GBP/USD and USD/JPY amid rising US yields.


EUR/USD flirts with last week’s $1.0965 high
EUR/USD pushes higher as US market participants return from a prolonged Thanksgiving weekend.
The cross flirts with its four-month high at $1.0965, above which beckon the late-June high at $1.1012 and the August peak at $1.1065.
A bullish continuation remains the most likely scenario as long as Wednesday’s low at $1.0853 underpins. Minor support above that low comes in around Wednesday’s $1.0923 high.

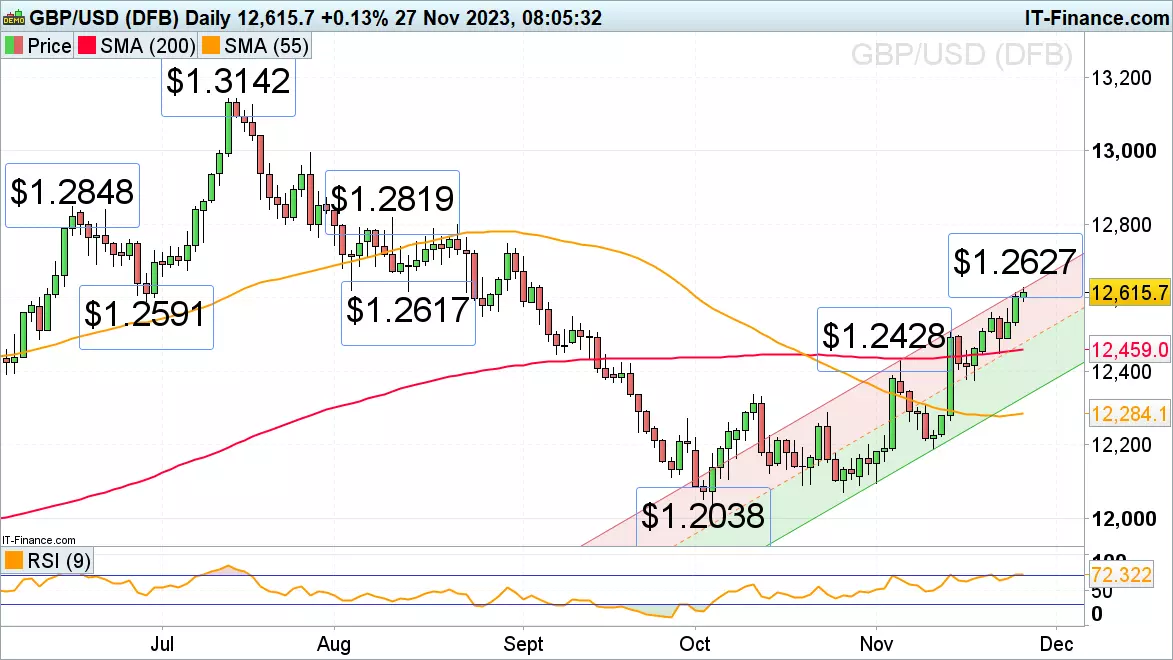
GBP/USD advances to near three-month highs
GBP/USD is trading in near three-month highs as the greenback continues to weaken. The next upside target is the late-August peak at $1.2746.
Minor support can be found around the late-June low at $1.2591, Tuesday’s high at $1.2559 and the mid-November high at $1.2506.
The medium-term uptrend will remain valid while Wednesday’s low and the 200-day simple moving average (SMA) at $1.2459 to $1.245 underpin.
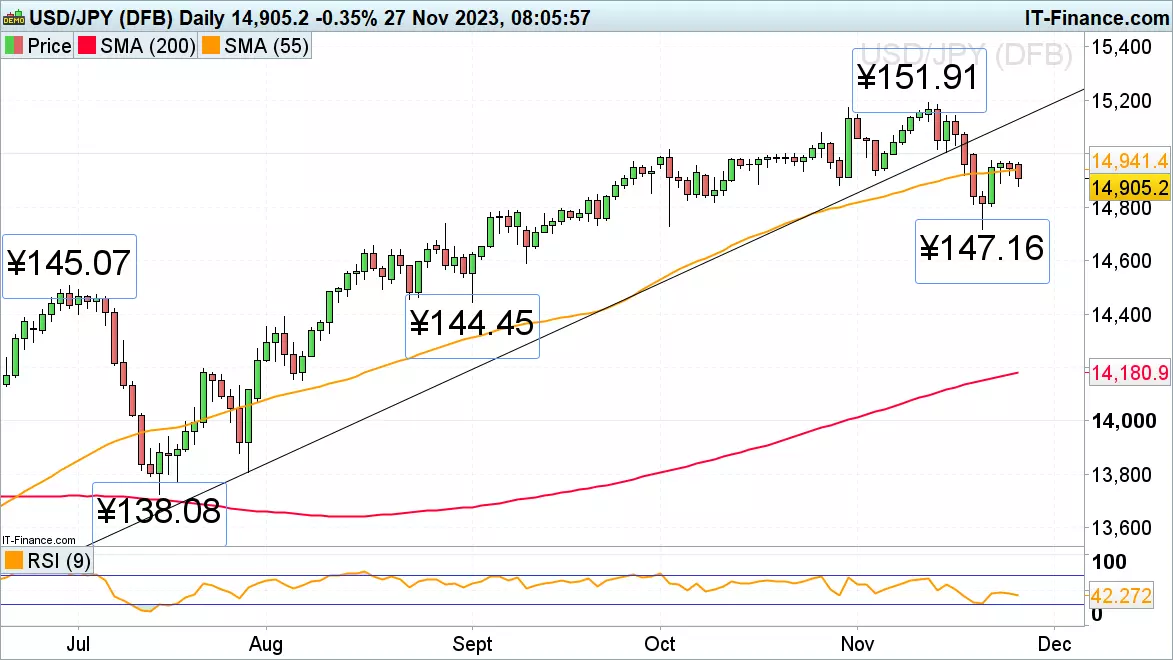
USD/JPY loses upside momentum
USD/JPY’s bounce off last week’s low at ¥147.16 took it to Wednesday’s high at ¥149.75 before consolidating. Earlier this morning the cross began to keel over and slip back to the late-October low at ¥148.81.
Further minor support comes in at the 10 October low at ¥148.17 and at the early October trough at ¥147.29 ahead of last week’s ¥147.16 low.
Only a rise above ¥149.75 would target the early-October peak at ¥150.16. Further potential minor resistance can be spotted at the 26 October high at ¥150.78.
The information on this page does not contain a record of our trading prices, or an offer of, or solicitation for, a transaction in any financial instrument. IG Bank S.A. accepts no responsibility for any use that may be made of these comments and for any consequences that result. No representation or warranty is given as to the accuracy or completeness of this information. Consequently any person acting on it does so entirely at their own risk. Any research provided does not have regard to the specific investment objectives, financial situation and needs of any specific person who may receive it and as such is considered to be a marketing communication. Although we are not specifically constrained from dealing ahead of our recommendations we do not seek to take advantage of them before they are provided to our clients. See full non-independent research disclaimer.

Start trading forex today
Find opportunity on the world’s most-traded – and most-volatile – financial market
- Trade spreads from just 0.6 points on EUR/USD
- Analyse with clear, fast charts
- Speculate wherever you are with our intuitive mobile apps
See an FX opportunity?
Try a risk-free trade in your demo account, and see whether you’re onto something.
- Log in to your demo
- Take your position
- See whether your hunch pays off
See an FX opportunity?
Don’t miss your chance – upgrade to a live account to take advantage.
- Get spreads from just 0.6 points on popular pairs
- Analyse and deal seamlessly on fast, intuitive charts
- See and react to breaking news in-platform
See an FX opportunity?
Don’t miss your chance. Log in to take your position.
Live prices on most popular markets
- Forex
- Shares
- Indices
Prices above are subject to our website terms and agreements. Prices are indicative only. All shares prices are delayed by at least 15 mins.
