Next shares close to 2024 highs ahead of full-year results
Retail titan Next has seen its shares consolidate so far this year after hitting a record high.


Next earnings – what to expect
Next reports full-year earnings on 21 March. Revenue is expected to come in at £1.86 billion, down from £1.87 billion last year. Meanwhile, pre-tax profit is forecast to surge to £931 million from last year’s £869 million.
Recent performance – strong Christmas leads to upgraded forecast
Next reported strong Christmas trading, with full-price sales up 5.7% in the nine weeks to December 30th, well ahead of its 2% growth expectations. This was driven by a 9.1% increase in online sales, while retail store sales grew more modestly.
As a result, Next upgraded its full-year pre-tax profit guidance by £20 million to £905 million. It expects net debt to fall from £797 million to around £700 million for the year.
For fiscal 2024/25, Next forecasts pre-tax profits rising further to around £940 million, despite acquisition charges. Net debt is projected to decline to £625 million.
The positive update sent Next shares 5.4% higher. Analysts praised Next's ability to drive full-price sales and avoid discounting, protecting its industry-leading margins. The fast-growing online division now makes up over half of total sales.
Returns to shareholders to continue
While economic headwinds persist, Next is seen weathering the storm well thanks to its strong brand, digital capabilities, and out-of-town store footprint. The company plans to return around £525 million to shareholders in 2024/25 through dividends and buybacks.
Technical analysis on the Next share price ahead of Thursday’s Q4 trading statement
Next’s share price, up around 5.5% year-to-date and by 28% over the past year, surpassed its September 2021 peak at 8,472p and has so far risen to an all-time record high at 8,646p in January. Since then it has range traded between this high and its mid-February low at 8,072p.
Next Monthly Chart
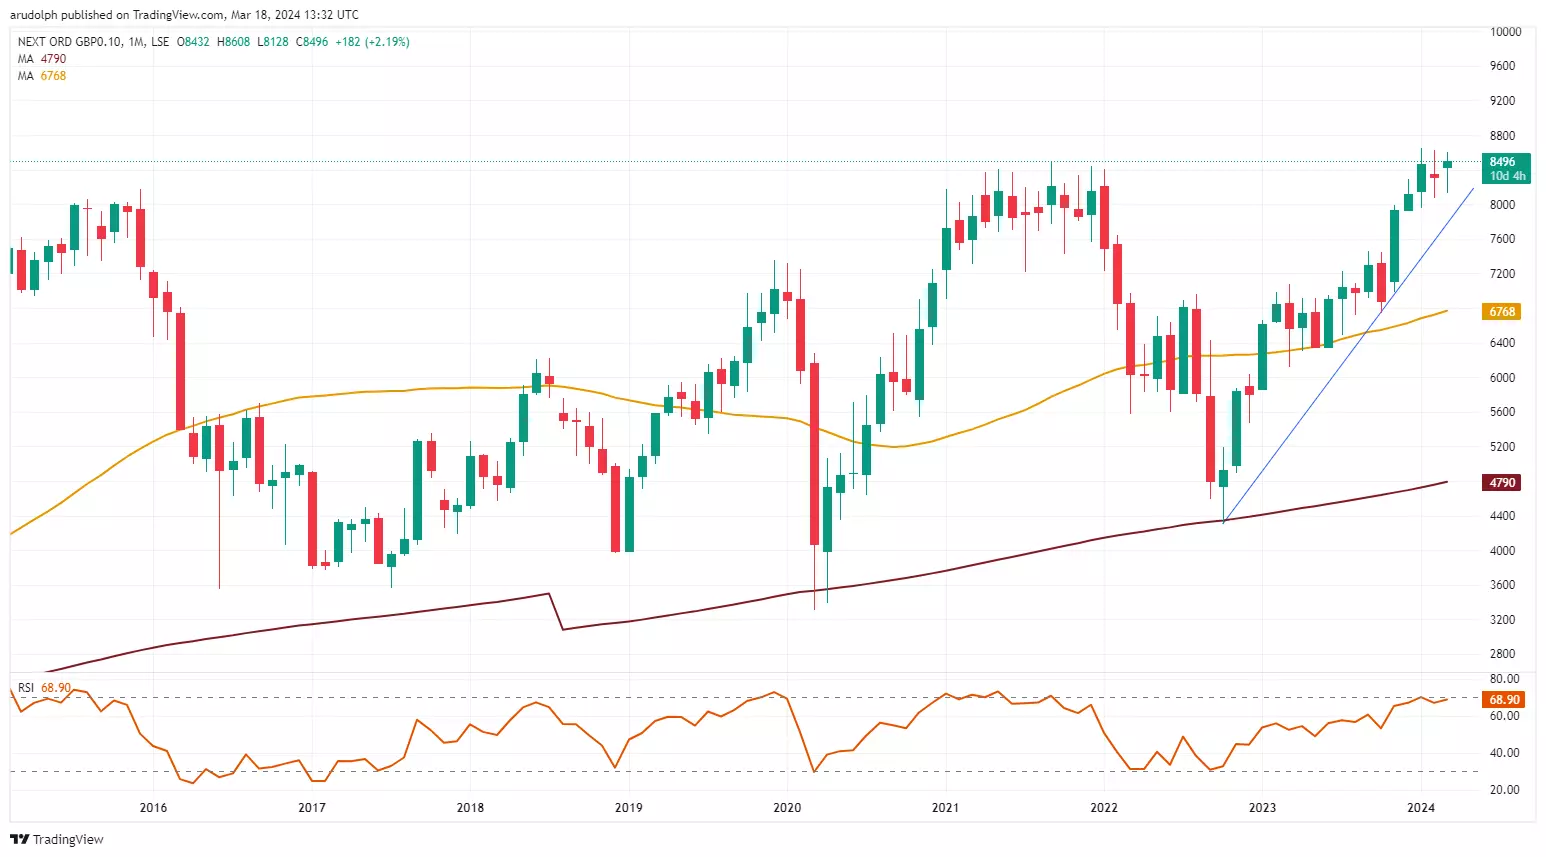
While the October-to-March uptrend line at 8,290p underpins, immediate upside pressure should be maintained. Above it meanders the 55-day simple moving average (SMA) at 8,400p.
Next Daily Chart
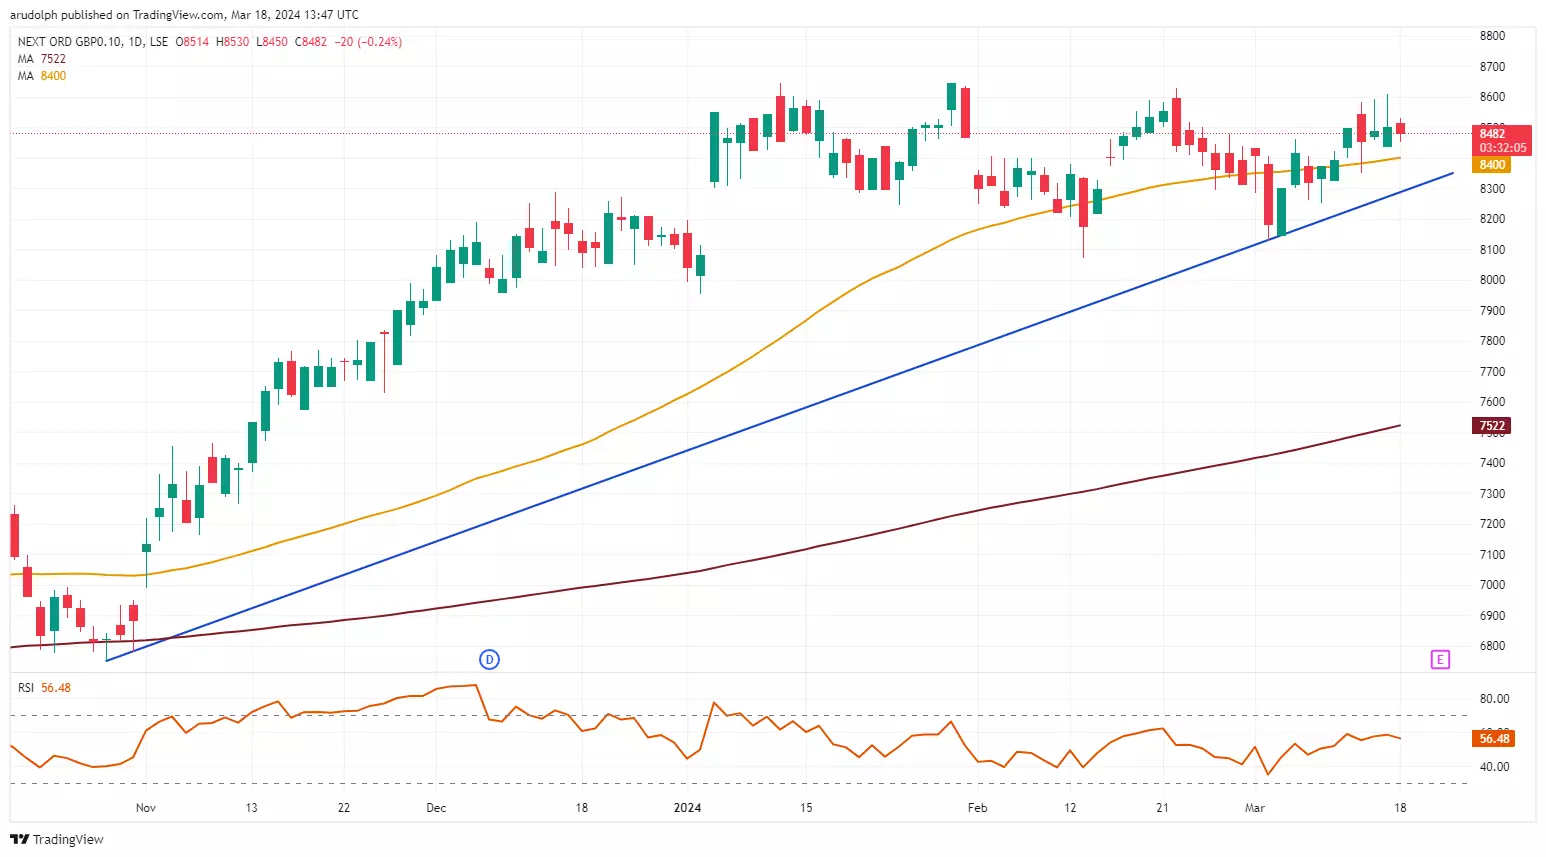
Key resistance sits between the January-to-March highs at 8,608p to 8,646p which has so far been tested four times this year but not broken through.
A rise and daily chart close above the 8,646p January peak would put the psychological 9,000p mark on the map.
Analysts recommendations and IG sentiment
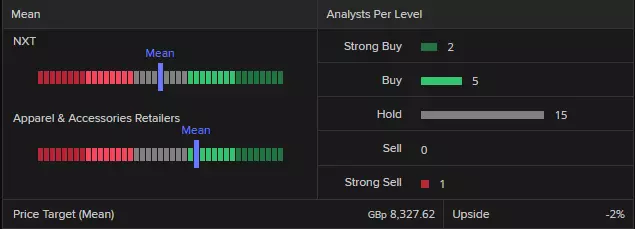
Fundamental analysts are rating Next as a ‘hold’ with Refinitiv data showing 2 strong buy, 5 buy, 15 hold, zero sells but 1 strong sell - with the mean of estimates suggesting a long-term price target of 8,328 pence for the share, roughly 2% above the share’s current price (as of 18 January 2024).
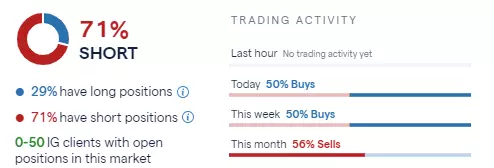
IG sentiment data shows that 71% of clients with open positions on the share (as of 18 January 2024) expect the price to fall over the near term, while 29% of clients expect the price to rise. Trading activity today shows 56% of sells this month.
The information on this page does not contain a record of our trading prices, or an offer of, or solicitation for, a transaction in any financial instrument. IG Bank S.A. accepts no responsibility for any use that may be made of these comments and for any consequences that result. No representation or warranty is given as to the accuracy or completeness of this information. Consequently any person acting on it does so entirely at their own risk. Any research provided does not have regard to the specific investment objectives, financial situation and needs of any specific person who may receive it and as such is considered to be a marketing communication. Although we are not specifically constrained from dealing ahead of our recommendations we do not seek to take advantage of them before they are provided to our clients. See full non-independent research disclaimer.

Act on share opportunities today
Go long or short on thousands of international stocks with CFDs.
- Get full exposure for a comparatively small deposit
- Trade on spreads from just 0.1%
- Get greater order book visibility with direct market access
See opportunity on a stock?
Try a risk-free trade in your demo account, and see whether you’re on to something.
- Log in to your demo
- Take your position
- See whether your hunch pays off
See opportunity on a stock?
Don’t miss your chance – upgrade to a live account to take advantage.
- Trade a huge range of popular stocks
- Analyse and deal seamlessly on fast, intuitive charts
- See and react to breaking news in-platform
See opportunity on a stock?
Don’t miss your chance. Log in to take your position.
Live prices on most popular markets
- Forex
- Shares
- Indices
Prices above are subject to our website terms and agreements. Prices are indicative only. All shares prices are delayed by at least 15 mins.
