Gold, oil and corn prices all drop back
Commodity prices have come under pressure, with the downtrends in oil and corn reasserting themselves.

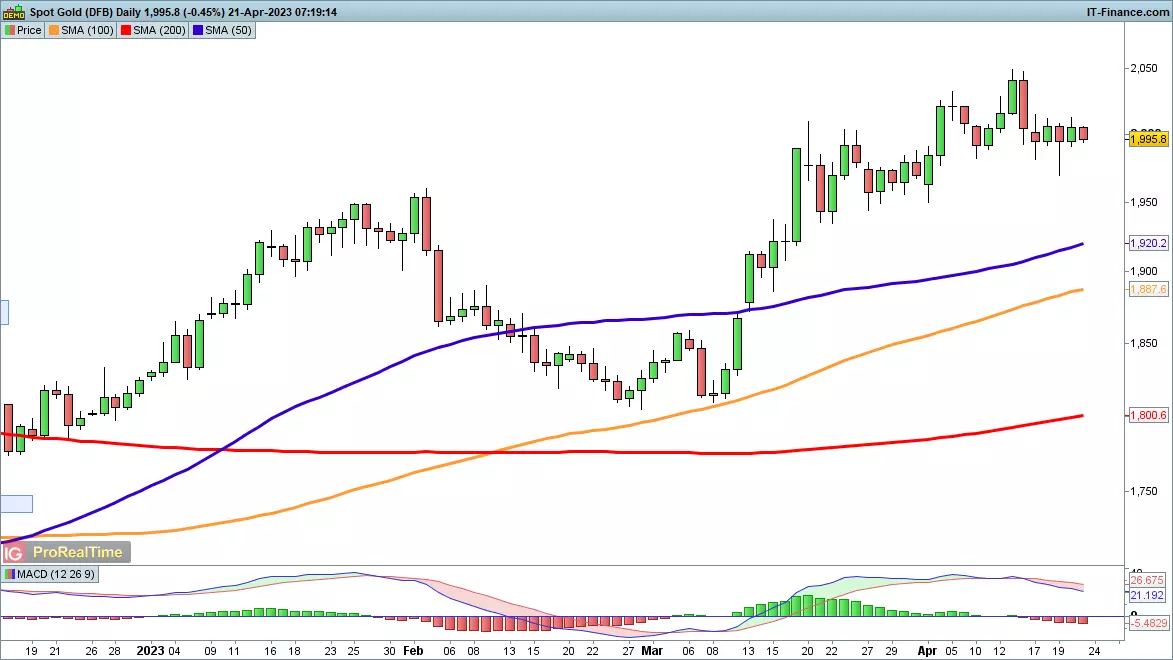
Gold drops back below $2000
The gold price has stabilised after Wednesday’s drop and recovery, though a declining MACD may well stay the buyers’ hand for now.
Should a bigger retracement develop, then the 50-day and 100-day simple moving averages (SMAs) come back into play as possible support. Having created higher highs in February and April, and a higher low in February, the uptrend is firmly intact.
Fresh gains would target $2050 and then the 2022 peak at $2070.
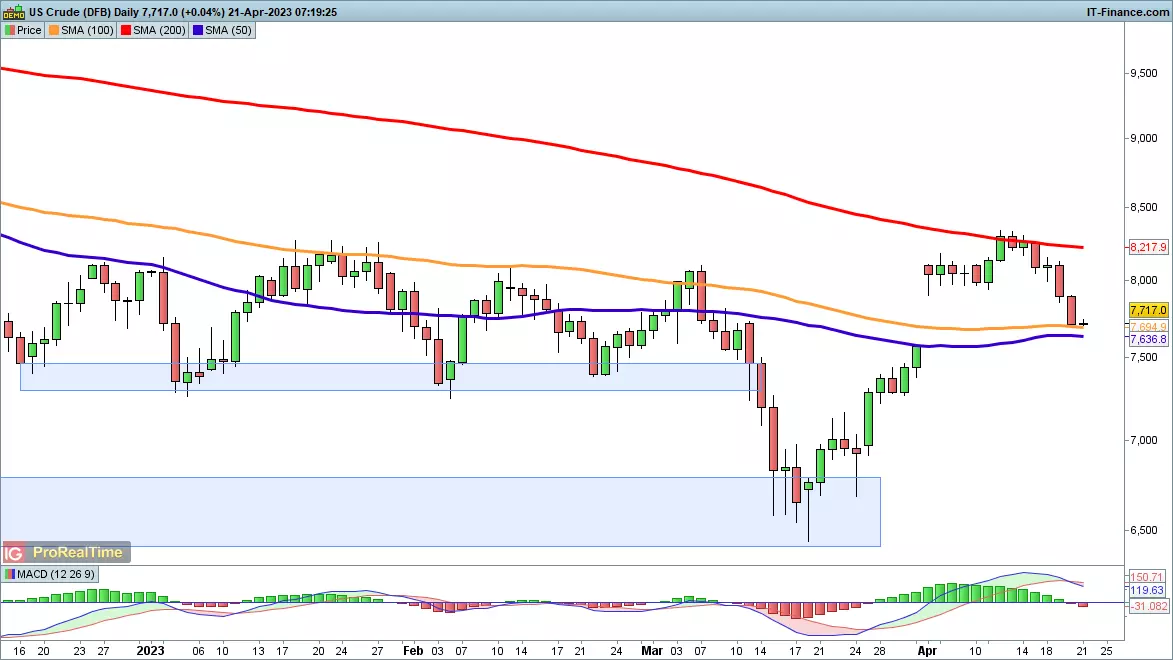
WTI falls back to 100-day MA
The oil price is now filling the gap created by OPEC’s surprise decision to cut output at the end of March.
This arguably revives the bearish thesis, with the price now below the $80 mark that was the high in early March. Additional declines below the 100- and 50-day SMAs would then potentially open the way to an eventual test of the March lows at $65.
Buyers will want to see a recovery above $80 and then a move on above the 200-day SMA to help recover a more bullish view.
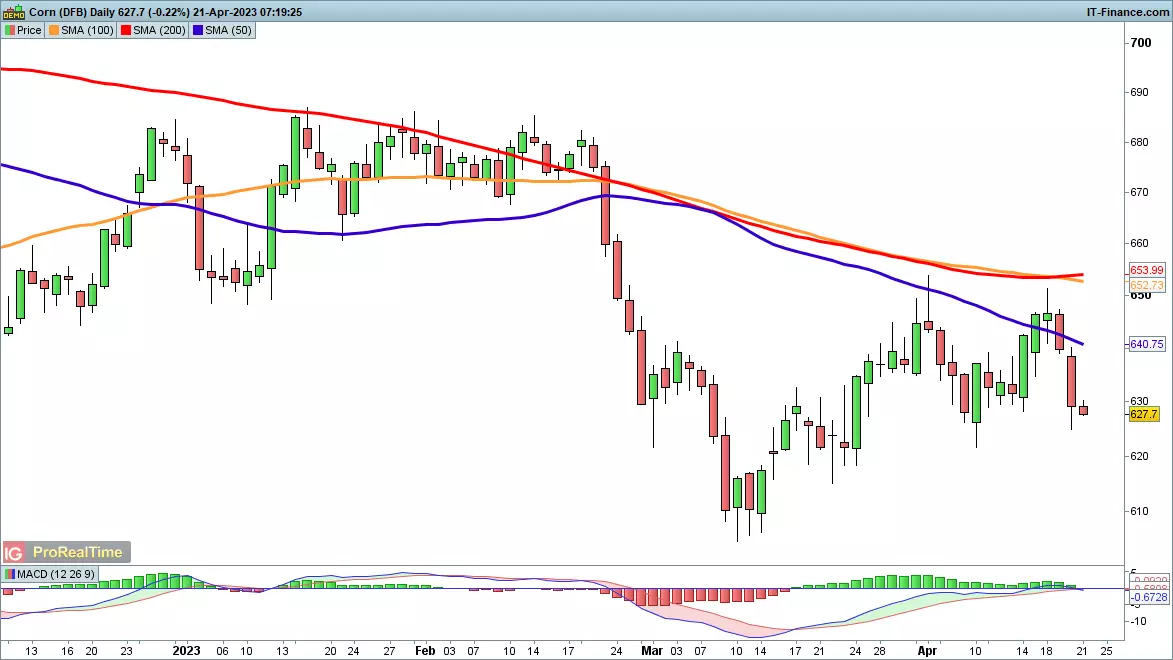
Corn heads lower
Two attempts in April to clear 650 have run out of momentum, and with the price now back below the 50-day SMA it looks like a move back towards 610 could be developing.
The downtrend is still in place with the failure to move back above 650, and the declining 50-day SMA points towards a continued bearish view.
A rally above 650 would then open the way to the February highs around 685.
The information on this page does not contain a record of our trading prices, or an offer of, or solicitation for, a transaction in any financial instrument. IG Bank S.A. accepts no responsibility for any use that may be made of these comments and for any consequences that result. No representation or warranty is given as to the accuracy or completeness of this information. Consequently any person acting on it does so entirely at their own risk. Any research provided does not have regard to the specific investment objectives, financial situation and needs of any specific person who may receive it and as such is considered to be a marketing communication. Although we are not specifically constrained from dealing ahead of our recommendations we do not seek to take advantage of them before they are provided to our clients. See full non-independent research disclaimer.

Act on share opportunities today
Go long or short on thousands of international stocks with CFDs.
- Get full exposure for a comparatively small deposit
- Trade on spreads from just 0.1%
- Get greater order book visibility with direct market access
See opportunity on a stock?
Try a risk-free trade in your demo account, and see whether you’re on to something.
- Log in to your demo
- Take your position
- See whether your hunch pays off
See opportunity on a stock?
Don’t miss your chance – upgrade to a live account to take advantage.
- Trade a huge range of popular stocks
- Analyse and deal seamlessly on fast, intuitive charts
- See and react to breaking news in-platform
See opportunity on a stock?
Don’t miss your chance. Log in to take your position.
Live prices on most popular markets
- Forex
- Shares
- Indices
Prices above are subject to our website terms and agreements. Prices are indicative only. All shares prices are delayed by at least 15 mins.
