Rolls Royce shares: what to expect from half year results?
As Rolls-Royce gets set to report H1 results, investors will be hoping that the worst is in the past after a torrid 2020 which led to a full-year loss of almost £4 billion. IG’s Victoria Scholar looks at the chart.
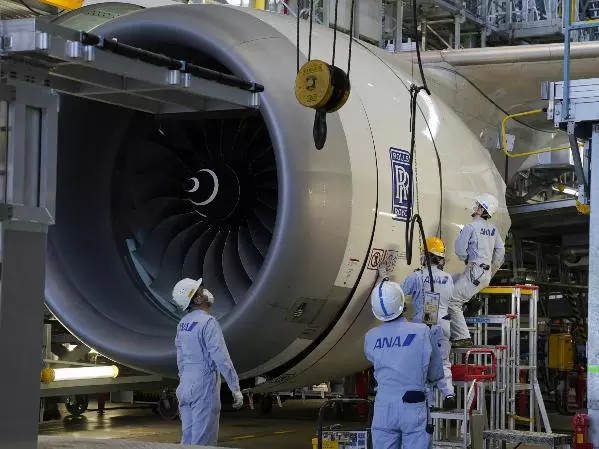
Rolls-Royce set to report H1 - where next for the shares?
Rolls-Royce gets set to report 2021 half year (H1) results on Thursday 5 August. In March the aircraft-engine maker announced a full-year (FY) loss of almost £4 billion, swinging from a profit of £583 million in the previous year. Investors will be hoping that the worst is behind Rolls-Royce, which suffered a sharp drop in revenues during the Covid-19 pandemic.
Rolls-Royce undertook a massive restructuring plan, cutting 9000 jobs and raising cash from investors through a rights issue and extra borrowing. It also sold off parts of the business worth £2 billion.
According to UBS, it will 'likely be another difficult set of results'. Earnings before interest and tax (EBIT) are forecast to come in at a loss of £129 million, that’s a major improvement from last years £1.67 billion loss but remains in the red.
Despite this, analysts at Citi are still optimistic on Rolls-Royce. In July the analyst team wrote the shares offer ‘significant long-term value’, providing a buy rating on the stock. Citi added, 'We do not know when the wide body market will recover, but we do believe it will. When it does, we expect Rolls-Royce to recover faster (as it has more new deliveries adding to the fleet and fewer old aircraft being retired).'
Find out more on how to buy, sell and short Rolls Royce shares

Rolls Royce share price technical analysis
After a multi-year period of declines for Rolls-Royce, October marked the start of a countermove with shares rallying more than 340% from the trough to the peak in December. However, since then, losses have come back into play with a descending trendline marked by lower lows and lower highs. Shares have given back nearly 25% since the 2020 highs, breaking below psychological round number support at 100p.
Since mid-July the stock has been attempting to regain ground once again pushing back above 100p with the next resistance level in sight at the 23.6% Fibonacci retracement level at 109.65p. A break above would penetrate the descending trendline of resistance and might point to the potential for further strength. On the flip side, a break back below 100p might indicate a resumption of the long-term downtrend.
The information on this page does not contain a record of our trading prices, or an offer of, or solicitation for, a transaction in any financial instrument. IG Bank S.A. accepts no responsibility for any use that may be made of these comments and for any consequences that result. No representation or warranty is given as to the accuracy or completeness of this information. Consequently any person acting on it does so entirely at their own risk. Any research provided does not have regard to the specific investment objectives, financial situation and needs of any specific person who may receive it and as such is considered to be a marketing communication. Although we are not specifically constrained from dealing ahead of our recommendations we do not seek to take advantage of them before they are provided to our clients. See full non-independent research disclaimer.

Act on share opportunities today
Go long or short on thousands of international stocks with CFDs.
- Get full exposure for a comparatively small deposit
- Trade on spreads from just 0.1%
- Get greater order book visibility with direct market access
See opportunity on a stock?
Try a risk-free trade in your demo account, and see whether you’re on to something.
- Log in to your demo
- Take your position
- See whether your hunch pays off
See opportunity on a stock?
Don’t miss your chance – upgrade to a live account to take advantage.
- Trade a huge range of popular stocks
- Analyse and deal seamlessly on fast, intuitive charts
- See and react to breaking news in-platform
See opportunity on a stock?
Don’t miss your chance. Log in to take your position.
Live prices on most popular markets
- Forex
- Shares
- Indices
Prices above are subject to our website terms and agreements. Prices are indicative only. All shares prices are delayed by at least 15 mins.
