Tesla’s share price: what to expect from Q2 results
Find out what to expect from Tesla’s earnings results, how they will affect Tesla share price, and how to trade Tesla’s earnings.

When is Tesla’s results date?
Tesla announced that it will release its latest figures for quarter two (Q2) of 2021 on Monday, 26 July after market closes.
Tesla share price: forecasts from Q2 results
Based on Q2 deliveries, whose figures were released earlier this month, it was a record that was roughly within Wall Street estimates on a total of 201,250 vehicles delivered and production at 206,421. From a profit point of view, the issue is that 99% of those deliveries were made up of Model 3 and Y, less than 1% being the high-margin Model S and X models. And while newer versions of the latter two are expected to positively factor into future earnings, for the time being, traders and investors will have to settle with low-margin models to formulate the Q2 earnings story.
There have been price increases over the past quarter in an attempt to offset supply chain pressures that included raw materials price increases and chip shortages. And while higher prices and deliveries should translate into higher revenue, overcoming tested profit margins will also be noted. Difficulties in China not just on the regulatory front but also from domestic competition, deliveries rebounding in May and June from April’s slump.
There’s also exposure to crypto volatility, which last time around might have been a positive on bitcoin prices surging, but could be in for a bit more pain this time around given prices are considerably lower (roughly half its record $64,900 highs). Reliance on regulatory credits to take earnings into the green will wane as competitors aggressively tackle the electric vehicle (EV) market.
But aside from the updates on its latest products, model updates, and production plans, in the end it’s about the numbers, and expectations are for an earnings per share (EPS) of $0.96, and where revenue will nearly double last year’s $6.04 billion at $11.21 billion given the delivery and price increases. Targets continue to vary significantly when it comes to Tesla share prices, the average though close to where its current market price is hovering near. Recommendations are also across the board, but average out to a hold with slight upside bias (source: finance.yahoo.com).
Trading Tesla’s Q2 results: technical overview and trading strategies
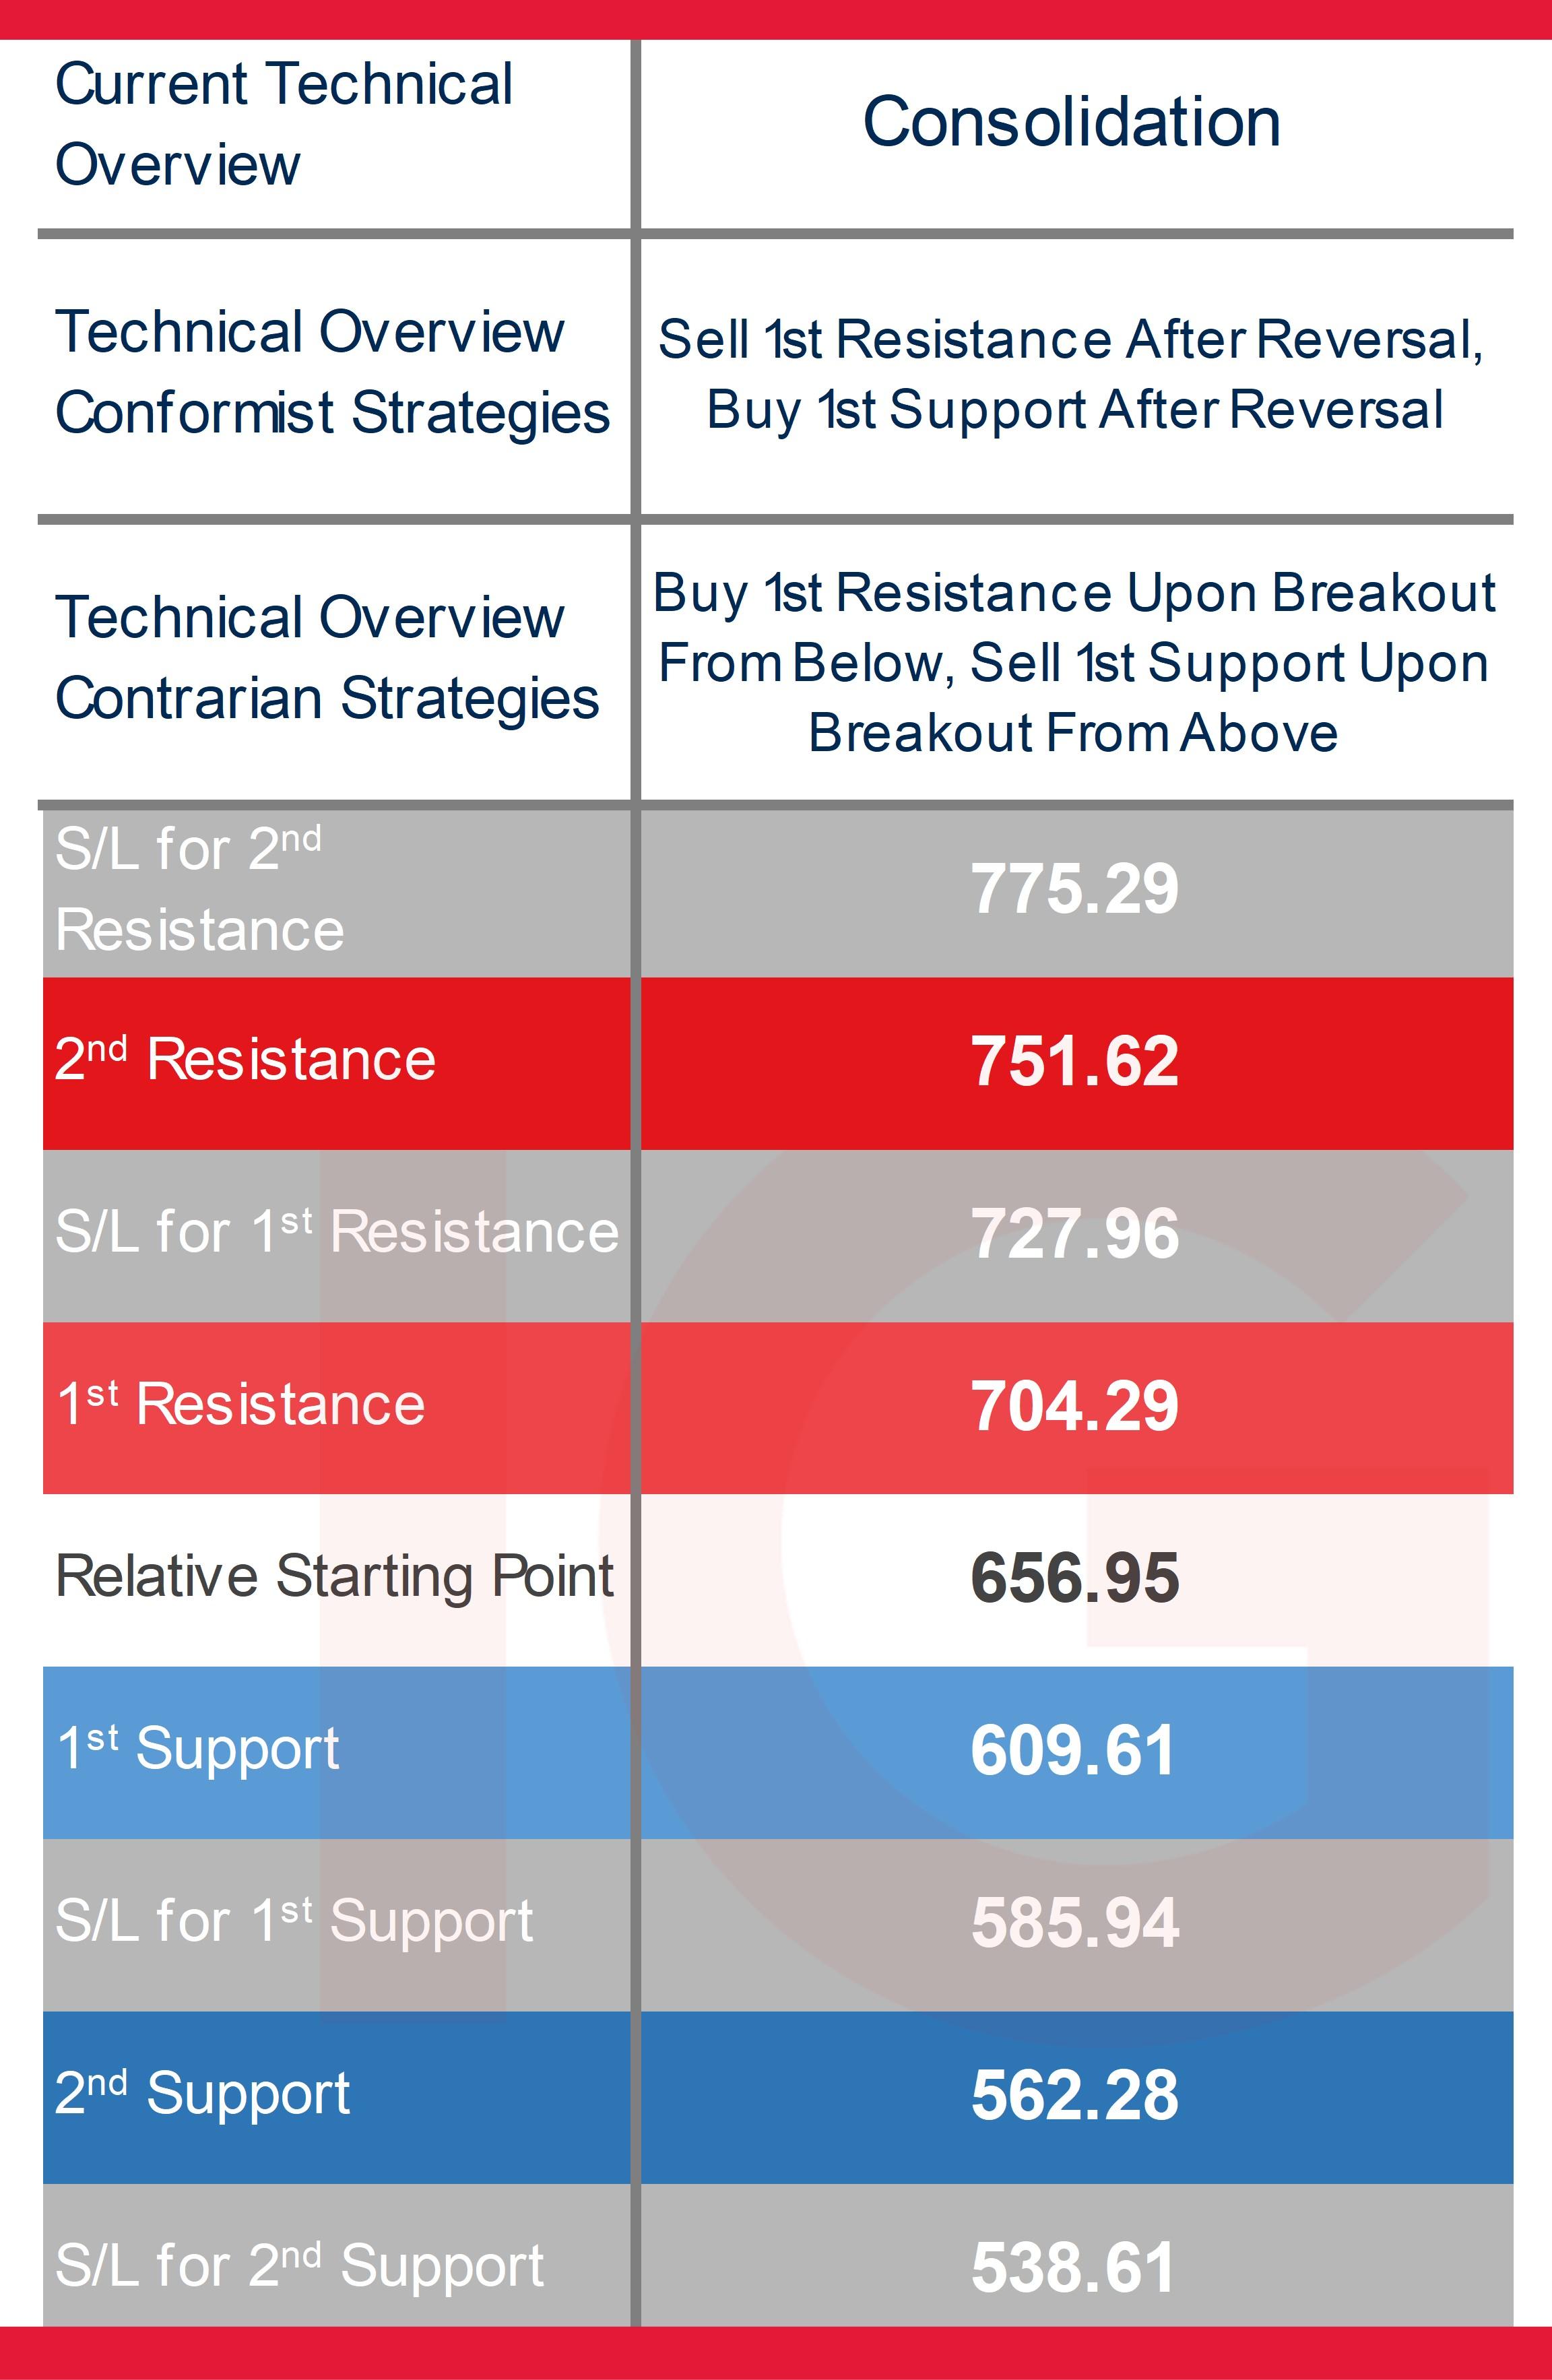
Technicals are of far less relevance when it comes to fundamental events that can take prices past key levels with ease, and the technical overview thus far has been consolidatory as prices oscillate staying above its main weekly long-term moving averages but where other key technical indicators are primarily neutral, an average directional movement index (ADX) no longer showing a propensity to trend in that time frame.
On a normal day, those looking to trade conforming to the technical overview might consider reversals (initiating a buy strategy after the fist support is broken only if prices manage to recover to that level, or initiating a sell position after the first resistance level is breached first and only if prices come back down to that level), given fading a volatile move will result in getting stopped out with ease. Those expecting a breakout and for the current technical overview to fail can consider breakout strategies when prices reach those levels to capitalise on a potential move to a new zone.

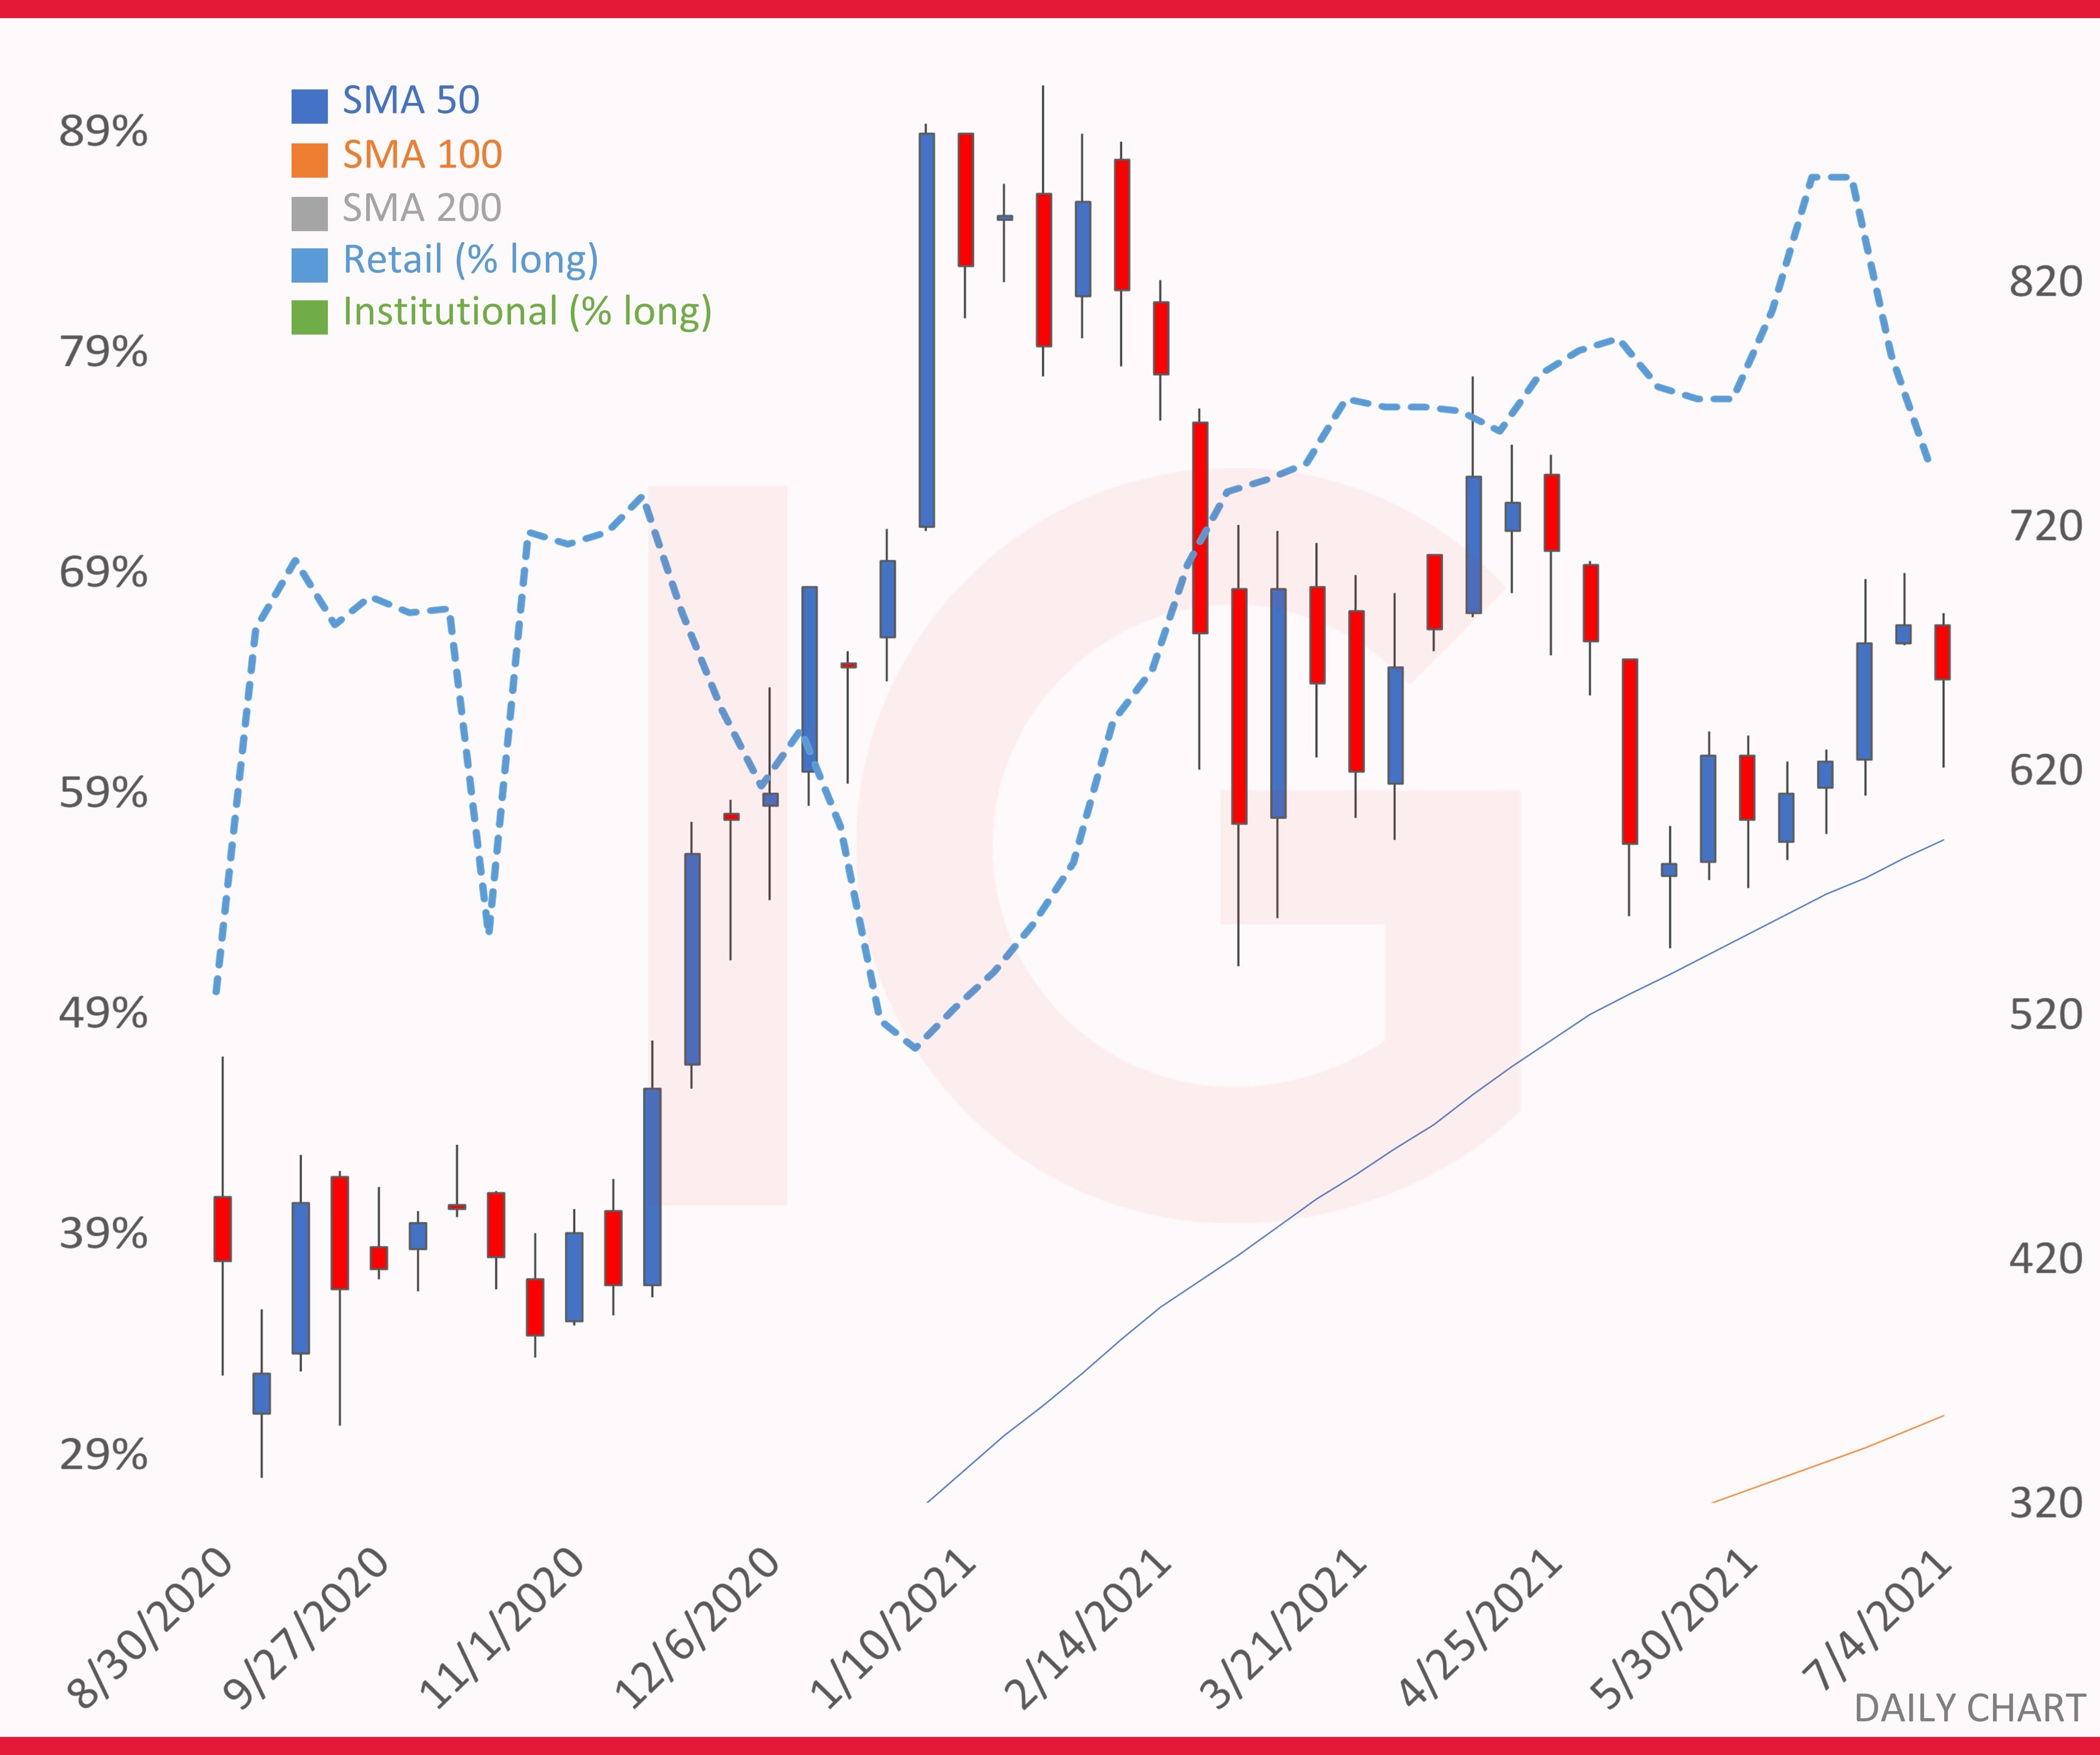
Tesla daily chart with retail sentiment

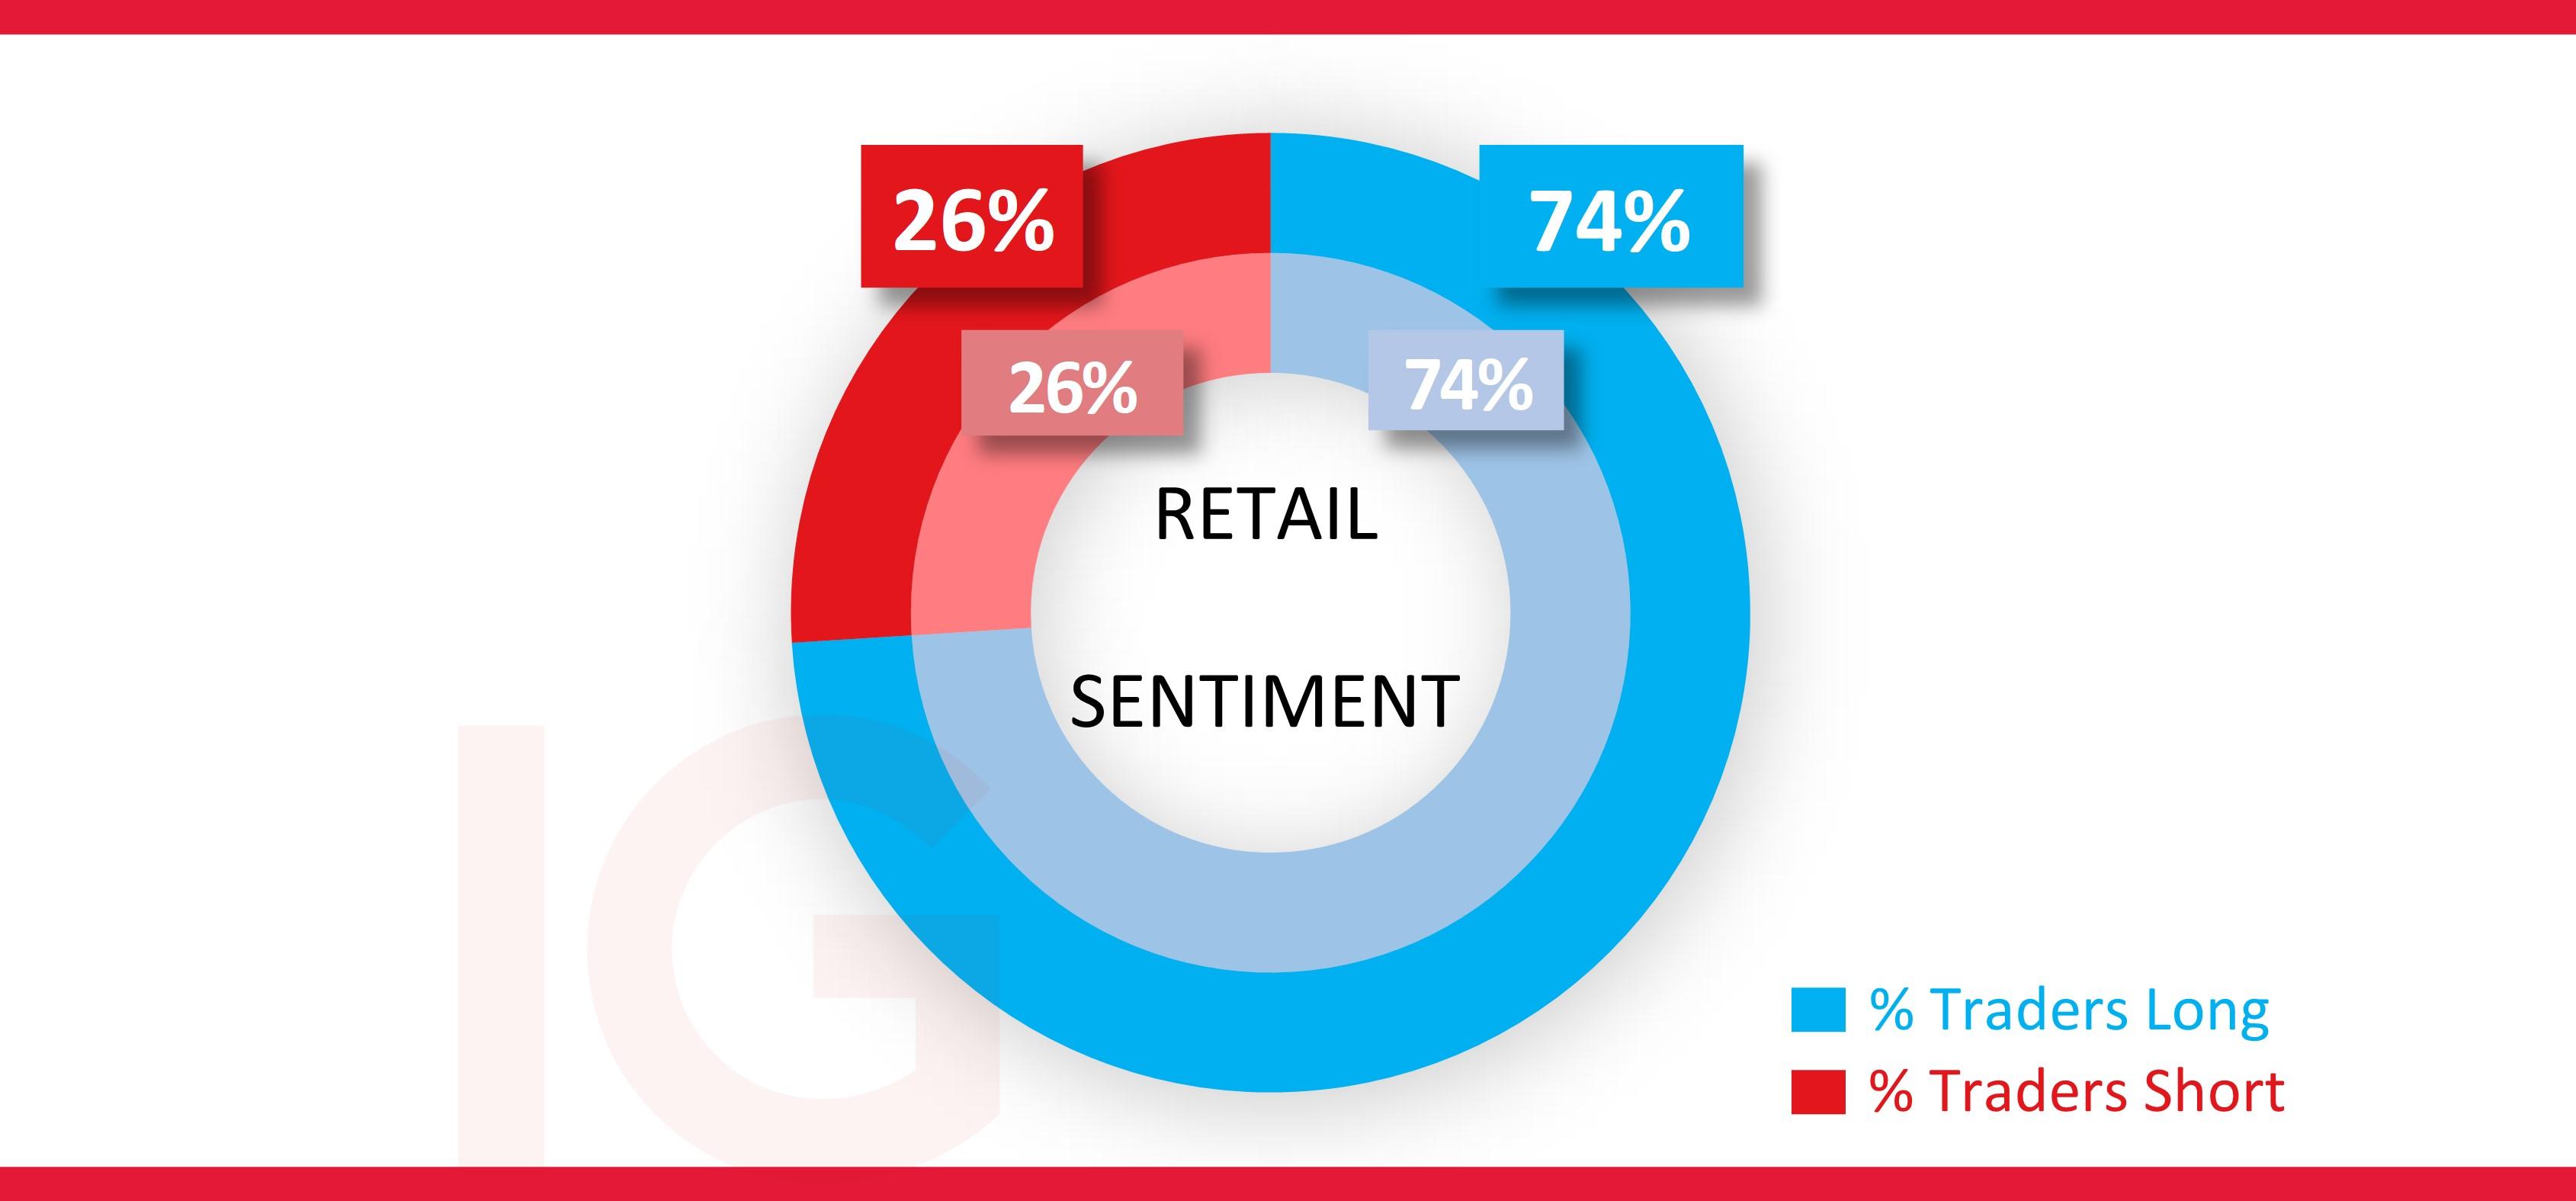
IG client sentiment* and short interest for Tesla shares
When it comes to client sentiment, it’s been a consistent heavy buy bias, the latest at 74% and below extreme buy 87% bias back in June as longs got enticed into closing out on the lift off of its previous short-term support level at around $540.
As for short interest, it’s considerably less than what it was at around the same time last year, when the figure was above 60 million. As of 30 June it was nearly half that amount, at 34,093,281, and is 4.4% of the shares floated, and dropping from 39,363,717 two weeks before that (source: shortsqueeze.com).

*The percentage of IG client accounts with positions in this market that are currently long or short. Calculated to the nearest 1%, as of today morning 8am for the outer circle. Inner circle is from the previous trading day.
The information on this page does not contain a record of our trading prices, or an offer of, or solicitation for, a transaction in any financial instrument. IG Bank S.A. accepts no responsibility for any use that may be made of these comments and for any consequences that result. No representation or warranty is given as to the accuracy or completeness of this information. Consequently any person acting on it does so entirely at their own risk. Any research provided does not have regard to the specific investment objectives, financial situation and needs of any specific person who may receive it and as such is considered to be a marketing communication. Although we are not specifically constrained from dealing ahead of our recommendations we do not seek to take advantage of them before they are provided to our clients. See full non-independent research disclaimer.

Act on share opportunities today
Go long or short on thousands of international stocks with CFDs.
- Get full exposure for a comparatively small deposit
- Trade on spreads from just 0.1%
- Get greater order book visibility with direct market access
See opportunity on a stock?
Try a risk-free trade in your demo account, and see whether you’re on to something.
- Log in to your demo
- Take your position
- See whether your hunch pays off
See opportunity on a stock?
Don’t miss your chance – upgrade to a live account to take advantage.
- Trade a huge range of popular stocks
- Analyse and deal seamlessly on fast, intuitive charts
- See and react to breaking news in-platform
See opportunity on a stock?
Don’t miss your chance. Log in to take your position.
Live prices on most popular markets
- Forex
- Shares
- Indices
Prices above are subject to our website terms and agreements. Prices are indicative only. All shares prices are delayed by at least 15 mins.

