Basics of technical analysis - free online course
Course overview
Description
Technical analysis can help you make sense of the way investor behaviour drives market prices. In this course we show you how to start using charts to forecast which way a market might move – helping you spot potential trading opportunities.
You’ll get to know the different types of chart available and how they work. And you’ll learn to identify some key chart patterns and understand their implications.
We’ll also introduce you to some of the most popular technical indicators – tools you can use to derive trading signals from market price data – and show you how to apply them.
Time
Level
Benefits
Lessons
-
1
Introduction to technical analysis
3 min -
2
Types of charts
6 min -
3
Support and resistance
4 min -
4
Breakouts and fakeouts
4 min -
5
Trends and channels
4 min -
6
Basic chart patterns: part one
5 min -
7
Basic chart patterns: part two
6 min -
8
Candlestick patterns
7 min -
9
Moving averages
5 min -
10
Using moving averages
6 min -
11
Choosing your analysis tools
5 min -
Quiz
10 questions
Example lesson: understanding support and resistance
In this course you’ll find exercises, charts and illustrations demonstrating how technical analysis can highlight potential opportunities to go long or short. To give you a flavour of what to expect, here’s an extract explaining the concepts of support and resistance:
The lines marked 1 and 2 below each represent a support or resistance level. Which is which?
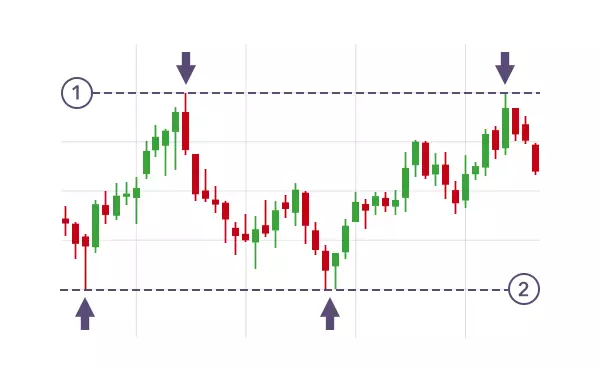
A. Line 1 is support, line 2 is resistance
B. Line 1 is resistance, line 2 is support
Answer is B.
Resistance is the ceiling that the price struggles to break through. Support is the floor where the price tends to stop declining.
The risks of loss from investing in CFDs can be substantial and the value of your investments may fluctuate. 69% of retail client accounts lose money when trading CFDs, with this investment provider. CFDs are complex instruments and come with a high risk of losing money rapidly due to leverage. You should consider whether you understand how this product works, and whether you can afford to take the high risk of losing your money.
CFD Accounts provided by IG International Limited. IG International Limited is licenced to conduct investment business and digital asset business by the Bermuda Monetary Authority.
IG provides an execution-only service. The information in this site does not contain (and should not be construed as containing) investment advice or an investment recommendation, or an offer of or solicitation for transaction in any financial instrument. IG accepts no responsibility for any use that may be made of these comments and for any consequences that result.
The information on this site is not directed at residents of the United States and is not intended for distribution to, or use by, any person in any country or jurisdiction where such distribution or use would be contrary to local law or regulation.
IG International Limited is part of the IG Group and its ultimate parent company is IG Group Holdings Plc. IG International Limited receives services from other members of the IG Group including IG Markets Limited.
©2003-2026
