EUR/USD, EUR/GBP and GBP/USD post ECB rate hike, ahead of FOMC and BoE rate decisions
Outlook on EUR/USD, EUR/GBP and GBP/USD following last week’s ECB rate hike ahead of this week’s Fed and BoE monetary policy meetings.

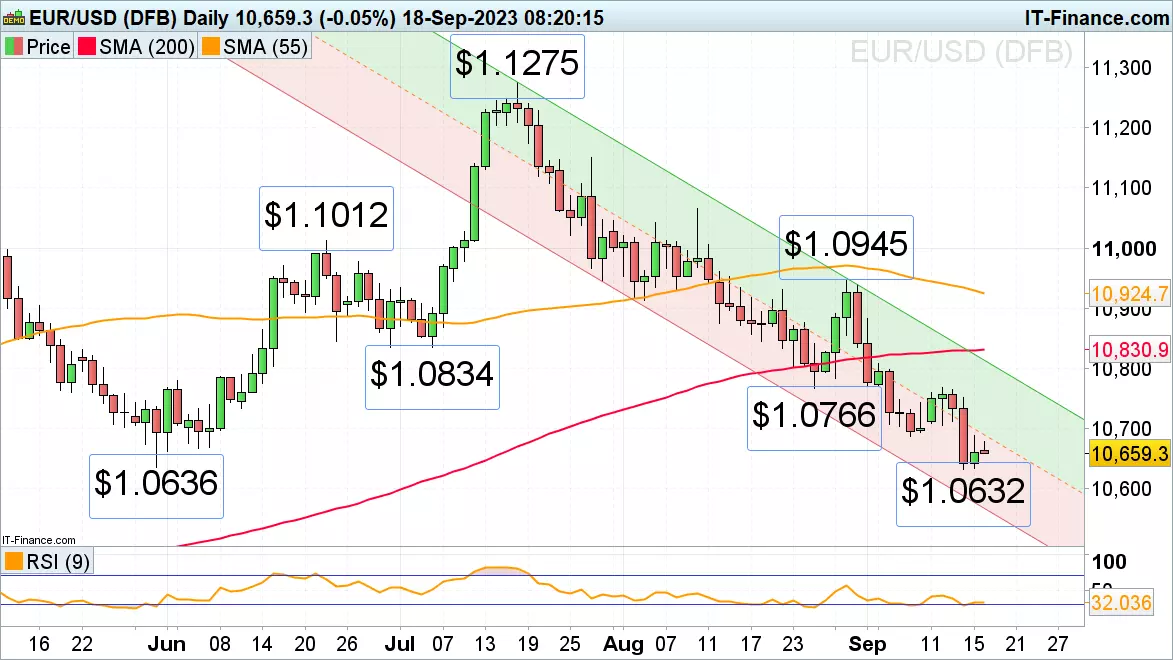
EUR/USD trades in 3 ½ month lows post ECB rate hike
Last week EUR/USD briefly dropped below its $1.0636 May low to $1.0632 following the European Central Bank’s (ECB) tenth rate hike in a row to 4.00% on its deposit rate and its dovish outlook. This week traders await the Federal Reserve’s (Fed) rate decision, expecting it to keep rates on hold.
A slide through and daily chart close below Thursday’s low at $1.0632 could lead to a drop towards the January and March lows at $1.0516 to $1.0484. For now the cross seems to hold, though, and while it continues to do so, the 7 September low at $1.0687 may be revisited.
Provided the currency pair remains below the last reaction high at $1.0769, seen last Tuesday, the July-to-September downtrend remains intact.
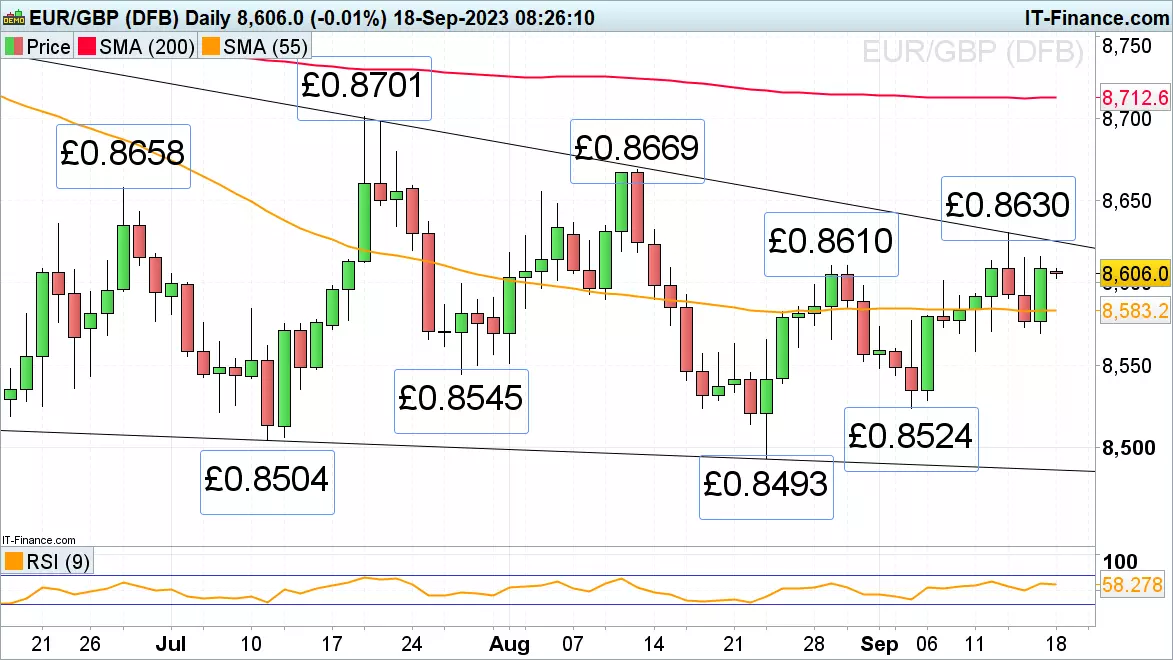
EUR/GBP traders await Fed and BoE rate decisions
EUR/GBP remains within its June-to-September sideways trading range, now back above its 55-day simple moving average (SMA) at £0.8583, as traders await a rate decision by the Bank of England (BoE) on Thursday. The majority of analysts expect a fifteenth consecutive rate hike to 5.5%.
Only a rise above last week’s high at £0.863 would push the $0.8658 to $0.8669 June and August highs to the fore.
Minor support is seen along the 55-day SMA at £0.8583 and at Friday’s £0.857 low. While it continues to hold, immediate upside pressure should be maintained.
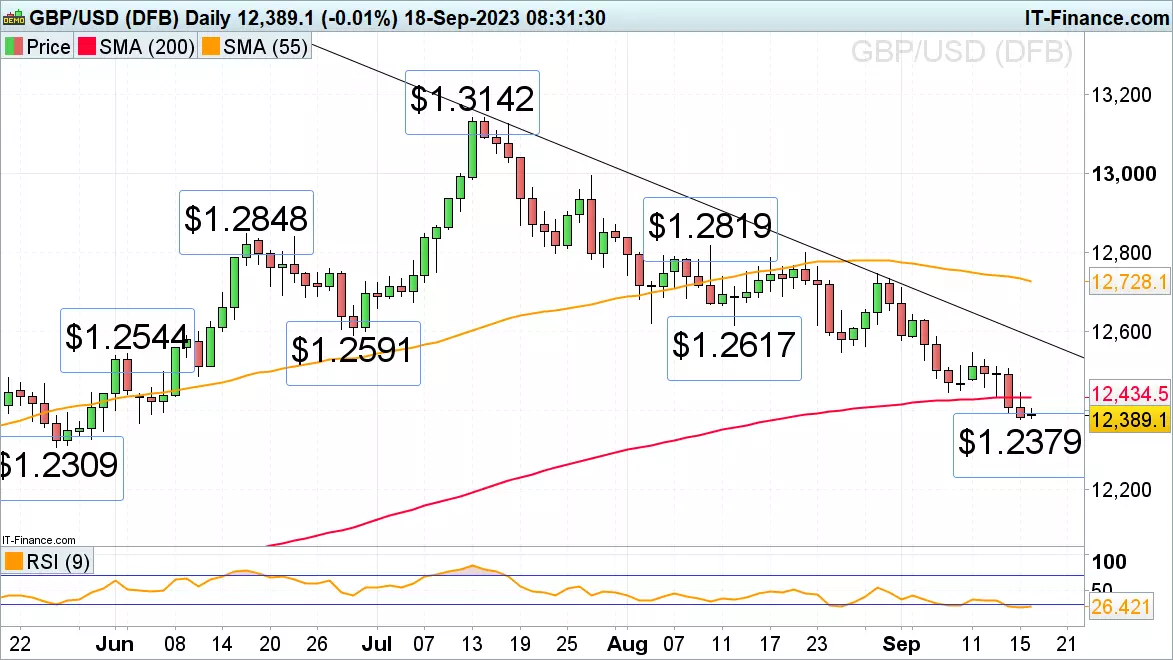
GBP/USD trades below its 200-day SMA
GBP/USD continues to slide as the majority of traders is expecting to see a rate hike at Thursday’s BoE monetary policy meeting.
The cross now trades below its 200-day SMA at $1.2434, which may act as minor resistance, and approaches its 3 ½ month low at $1.2379. A slip through it and the next lower June low at $1.2369 would target the May trough at $1.2309.
Minor resistance above the 200-day SMA remains to be seen at the 7 September low at $1.2446 and further up around the $1.2549 late August low and last Monday’s high.
IGA, may distribute information/research produced by its respective foreign affiliates within the IG Group of companies pursuant to an arrangement under Regulation 32C of the Financial Advisers Regulations. Where the research is distributed in Singapore to a person who is not an Accredited Investor, Expert Investor or an Institutional Investor, IGA accepts legal responsibility for the contents of the report to such persons only to the extent required by law. Singapore recipients should contact IGA at 6390 5118 for matters arising from, or in connection with the information distributed.
The information/research herein is prepared by IG Asia Pte Ltd (IGA) and its foreign affiliated companies (collectively known as the IG Group) and is intended for general circulation only. It does not take into account the specific investment objectives, financial situation, or particular needs of any particular person. You should take into account your specific investment objectives, financial situation, and particular needs before making a commitment to trade, including seeking advice from an independent financial adviser regarding the suitability of the investment, under a separate engagement, as you deem fit.
No representation or warranty is given as to the accuracy or completeness of this information. Consequently, any person acting on it does so entirely at their own risk. Please see important Research Disclaimer.
Please also note that the information does not contain a record of our trading prices, or an offer of, or solicitation for, a transaction in any financial instrument. Any views and opinions expressed may be changed without an update.

Start trading forex today
Trade the largest and most volatile financial market in the world.
- Spreads start at just 0.6 points on EUR/USD
- Analyse market movements with our essential selection of charts
- Speculate from a range of platforms, including on mobile
Live prices on most popular markets
- Forex
- Shares
- Indices
See more forex live prices
See more shares live prices
Prices above are subject to our website terms and agreements. Prices are indicative only. All shares prices are delayed by at least 15 mins.
See more indices live prices
Prices above are subject to our website terms and agreements. Prices are indicative only. All shares prices are delayed by at least 20 mins.
