FTSE 100: How to trade the Burberry’s share price around its first quarter trading statement
Outlook on the Burberry’s share price ahead of its first quarter trading statement on Friday.


Burberry’s fundamental background ahead of its Q1 trading statement
Burberry: The most recent annual report for Burberry (BRBY) seems very positive at first glance. Not only did their revenue, profits, and overall cash flow improve compared to the previous year, but they also saw a resurgence in sales in China once COVID-19 restrictions were lifted.
However, despite these positive developments, Burberry's stock prices dropped over 6% the morning they announced their results. This could be due to how Burberry's performance stacks up against other top-tier luxury brands. For example, LVMH (MC), the French company that owns Dior and Louis Vuitton, reported sales of €79bn (£69bn) and a profit of more than €21bn in 2022, both of which are up 23 per cent. When compared to these numbers, Burberry's growth seems less impressive.
Another factor could be declining demand in the US, where Burberry saw a 3% decrease in sales throughout the year and a 7% drop in the last quarter. The largest decrease was in their more affordable items, which could indicate that brands aimed towards ambitious consumers are struggling as US consumption slows down.
Despite these challenges, the global luxury market is known for being able to withstand economic downturns. Therefore, a continued slowdown in the US is unlikely to significantly impact Burberry's profits.
Currently, Burberry's shares are trading at 18 times their estimated earnings for 2024. Although Burberry's growth may not be as remarkable as LVMH's, its steady expansion suggests that the brand still holds good value amongst its competitors.
How to trade Burberry ahead of its Q1 trading statement?
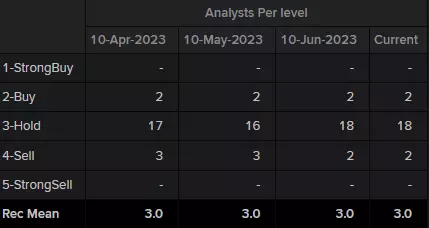
Refinitiv data shows a consensus analyst rating of ‘hold’ for Burberry – 2 buy, 18 hold and 2 sell - with the median of estimates suggesting a long-term price target of 2,342.50 pence for the share, roughly 13% higher than the current price (as of 11 July 2023).
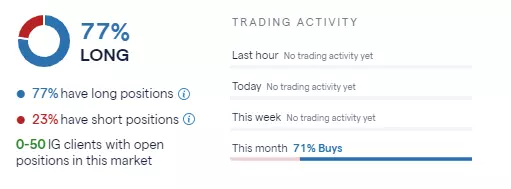
IG sentiment data shows that 77% of clients with open positions on the share (as of 11 July 2023) expect the price to rise over the near term, while 23% of clients expect the price to fall. This month 71% of clients bought the share.
Burberry’s share price – technical view
The Burberry’s share price, which at the beginning of the year rose by over 30% and made a new all-time high at 2,656 pence in April, has since given back all of this year’s gains.
Year-to-date the Burberry’s share price is down around 2%, slightly less than the FTSE 100.
Burberry Weekly Candlestick Chart
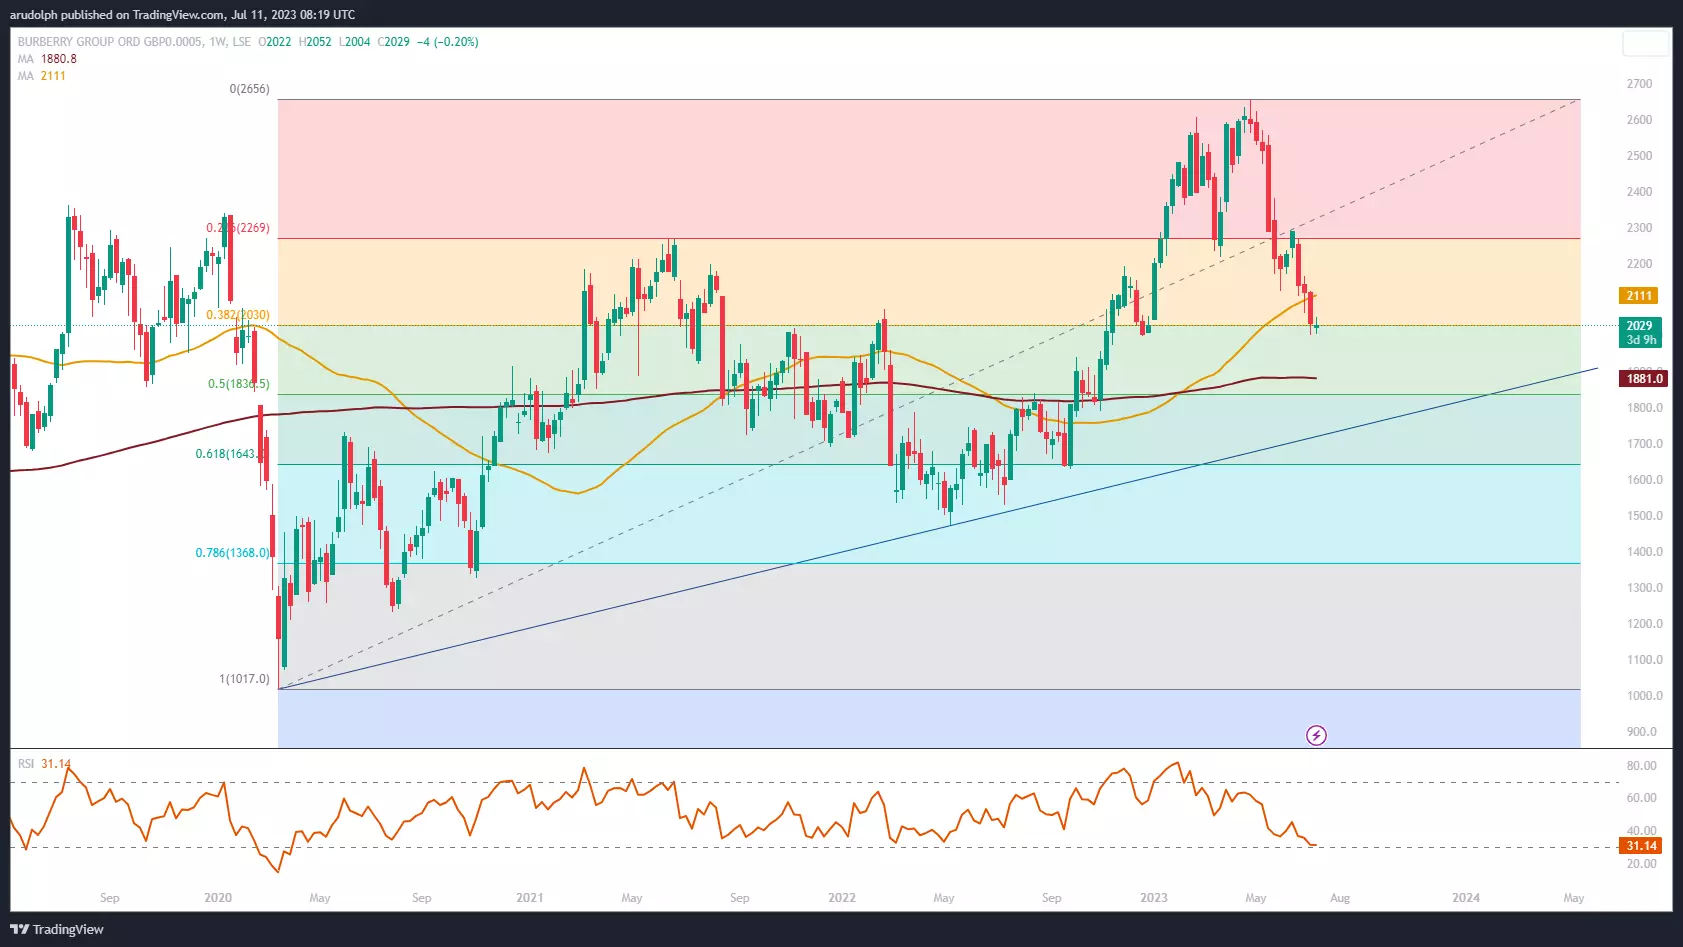
The 38.2% Fibonacci retracement of the 2020-to-2023 bull market at 2,032p is currently being revisited, a level around which the Burberry share price found support in June. While the area between it and the December 2022 low at 1,997.5p hold, a resumption of the long-term uptrend may remain in play.
Given the speed of the last few months’ near 25% decline from its all-time record April high at 2,656p, the odds favour further downside with the 200-week simple moving average (SMA) at 1,881p being eyed, together with the 50% retracement at 1,830.5p. This represents another potential 7%-to-9% decline in the Burberry’s share price.
As can be seen on the daily chart, the Burberry’s share price’s descent has remained below its May-to-July downtrend line at 2,081p despite the minor early to mid-June countertrend rally whish ran out of steam at the 2,289p June peak.
Burberry Daily Candlestick Chart
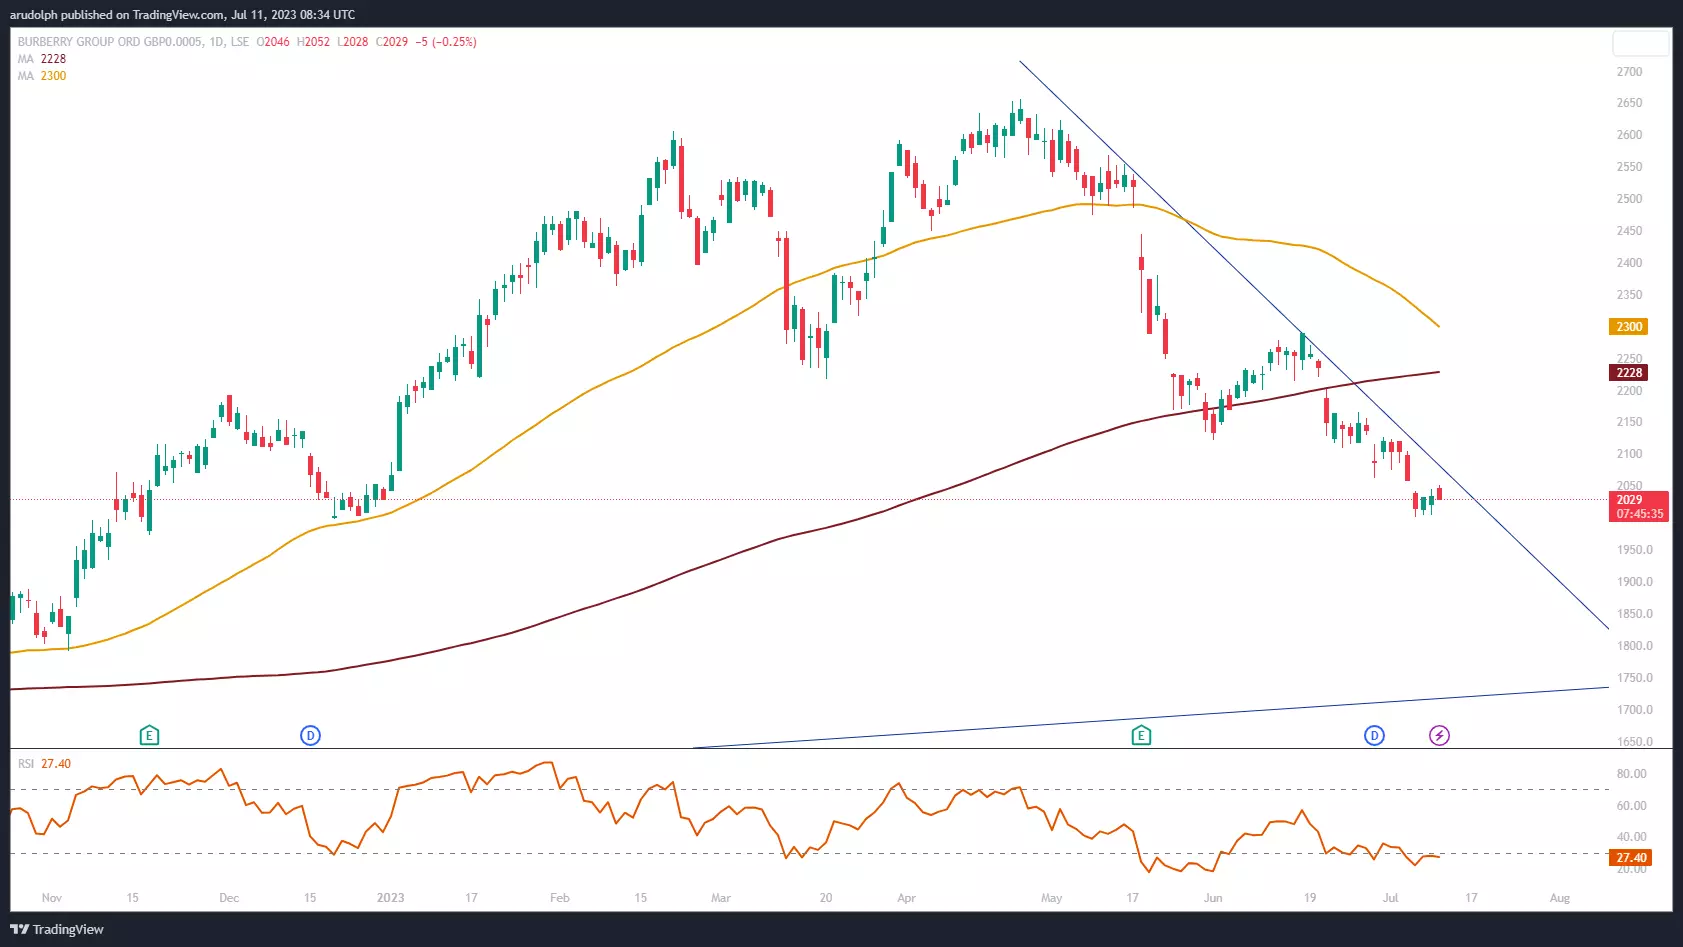
A fall through the current July low at 2,001p is likely to occur over the coming days, in which case the mid-November to late December lows at 1,997.5p to 1,973p may offer at least interim support.
Only a currently unexpected bullish reversal above the last reaction high on the daily candlestick chart - a daily high which is higher than the one of the candle to its left and right – at the late June 2,165 high would question this medium-term bearish outlook.
For a bottom to be formed the 200-day SMA at 2,228p should also be overcome, however, something that isn’t likely to occur in the days ahead.
IGA, may distribute information/research produced by its respective foreign affiliates within the IG Group of companies pursuant to an arrangement under Regulation 32C of the Financial Advisers Regulations. Where the research is distributed in Singapore to a person who is not an Accredited Investor, Expert Investor or an Institutional Investor, IGA accepts legal responsibility for the contents of the report to such persons only to the extent required by law. Singapore recipients should contact IGA at 6390 5118 for matters arising from, or in connection with the information distributed.
The information/research herein is prepared by IG Asia Pte Ltd (IGA) and its foreign affiliated companies (collectively known as the IG Group) and is intended for general circulation only. It does not take into account the specific investment objectives, financial situation, or particular needs of any particular person. You should take into account your specific investment objectives, financial situation, and particular needs before making a commitment to trade, including seeking advice from an independent financial adviser regarding the suitability of the investment, under a separate engagement, as you deem fit.
No representation or warranty is given as to the accuracy or completeness of this information. Consequently, any person acting on it does so entirely at their own risk. Please see important Research Disclaimer.
Please also note that the information does not contain a record of our trading prices, or an offer of, or solicitation for, a transaction in any financial instrument. Any views and opinions expressed may be changed without an update.

Seize a share opportunity today
Go long or short on thousands of international stocks.
- Increase your market exposure with leverage
- Get spreads from just 0.1% on major global shares
- Trade CFDs straight into order books with direct market access
Live prices on most popular markets
- Forex
- Shares
- Indices
See more forex live prices
See more shares live prices
Prices above are subject to our website terms and agreements. Prices are indicative only. All shares prices are delayed by at least 15 mins.
See more indices live prices
Prices above are subject to our website terms and agreements. Prices are indicative only. All shares prices are delayed by at least 20 mins.
