Alphabet outlook solid ahead of upcoming earnings
Alphabet has made huge gains over the past year, and has found a new lease on life as money flows back into growth names. But will earnings meet already-high expectations?

When does Alphabet report earnings?
Alphabet publishes its most recent earnings on 27 July.
Alphabet earnings – what to expect
Revenue is expected to rise 46% to $56 billion, while earnings per share (EPS) are forecast to rise 90% to $19.26.
Advertising revenue continues to be the main slab of revenue for Apple, allowing it to fund loss-making expansion in areas such as cloud-computing, in which it competes with Amazon and Microsoft. For Alphabet, regulatory scrutiny continues to loom large, and will continue to be a major headache in coming quarters. But while fines may keep coming, they still amount to a drop in the ocean in terms of Alphabet’s revenue, and if not accompanied with real regulatory action, will represent only a passing trouble in the longer term, an excuse for regular selloffs but not a fundamental change in direction.
Alphabet – valuation and broker ratings
Like others in the growth/tech space, Alphabet continues to trade on a relatively high price-to-earnings (P/E) ratio, at 32.11, with no dividend yield at present. Brokers rate Alphabet highly, with 16 ‘strong buys’ and 28 ‘buys’, and just two ‘hold’ recommendations.
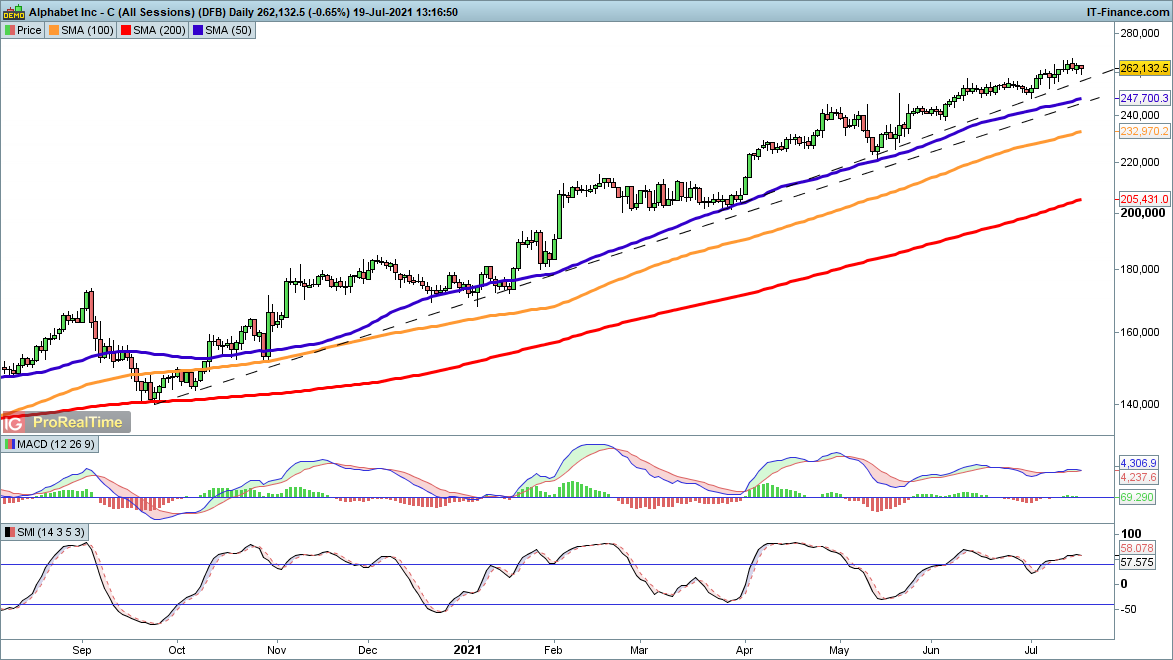
Alphabet share price
Alphabet seems unstoppable, having enjoyed a tremendous rally since September. Dips have been bought repeatedly, and since May a steady and quiet rally has provided very little chance for dip buyers to get involved. The price sits close to a new record high, having bounced in early May from the 50-day simple moving average (SMA), currently $2470. It is unlikely that this quiet rally will go on forever, so some caution might be warranted now, but with a clear eye on the steady trend.
Alphabet strides ahead
Fundamentals and technicals continue to back Alphabet, with the ad business powering expansion elsewhere. Growth stocks are still in high demand, and the recent inflow back into tech stocks since May seems to suggest a return to growth stocks after the ‘value’ mania of the early part of 2021.
IGA, may distribute information/research produced by its respective foreign affiliates within the IG Group of companies pursuant to an arrangement under Regulation 32C of the Financial Advisers Regulations. Where the research is distributed in Singapore to a person who is not an Accredited Investor, Expert Investor or an Institutional Investor, IGA accepts legal responsibility for the contents of the report to such persons only to the extent required by law. Singapore recipients should contact IGA at 6390 5118 for matters arising from, or in connection with the information distributed.
The information/research herein is prepared by IG Asia Pte Ltd (IGA) and its foreign affiliated companies (collectively known as the IG Group) and is intended for general circulation only. It does not take into account the specific investment objectives, financial situation, or particular needs of any particular person. You should take into account your specific investment objectives, financial situation, and particular needs before making a commitment to trade, including seeking advice from an independent financial adviser regarding the suitability of the investment, under a separate engagement, as you deem fit.
No representation or warranty is given as to the accuracy or completeness of this information. Consequently, any person acting on it does so entirely at their own risk. Please see important Research Disclaimer.
Please also note that the information does not contain a record of our trading prices, or an offer of, or solicitation for, a transaction in any financial instrument. Any views and opinions expressed may be changed without an update.

Seize a share opportunity today
Go long or short on thousands of international stocks.
- Increase your market exposure with leverage
- Get spreads from just 0.1% on major global shares
- Trade CFDs straight into order books with direct market access
Live prices on most popular markets
- Forex
- Shares
- Indices
See more forex live prices
See more shares live prices
Prices above are subject to our website terms and agreements. Prices are indicative only. All shares prices are delayed by at least 15 mins.
See more indices live prices
Prices above are subject to our website terms and agreements. Prices are indicative only. All shares prices are delayed by at least 20 mins.
