Alphabet Q2 Earnings: Three Key Areas to Watch
Alphabet, Google's parent company, is ready to reveal its Q2 2023 earnings July 25th, after the US market closes. Investors are keeping their eyes laser-focused on these three crucial areas.


Alphabet Q2 Earnings - When is the Earning Date?
Alphabet is scheduled to report its 'second quarter (Q2) 2023 earnings on Tuesday, July 25, after the US market closes.
Alphabet Q2 Earnings - What to Expect?
Revenue: Alphabet’s revenue for the quarter covering March to June 2023 is expected to reach $72.67 billion, 4% higher than the level in the same period last year.
EPS: The internet search leader is expected to deliver quarterly earnings of $1.34 per share, presenting a 3.8% year-over-year (YoY) growth and 25% higher than the previous quarter.
Alphabet Q2 Earnings - Three Key Areas to Watch
Advertising Revenue
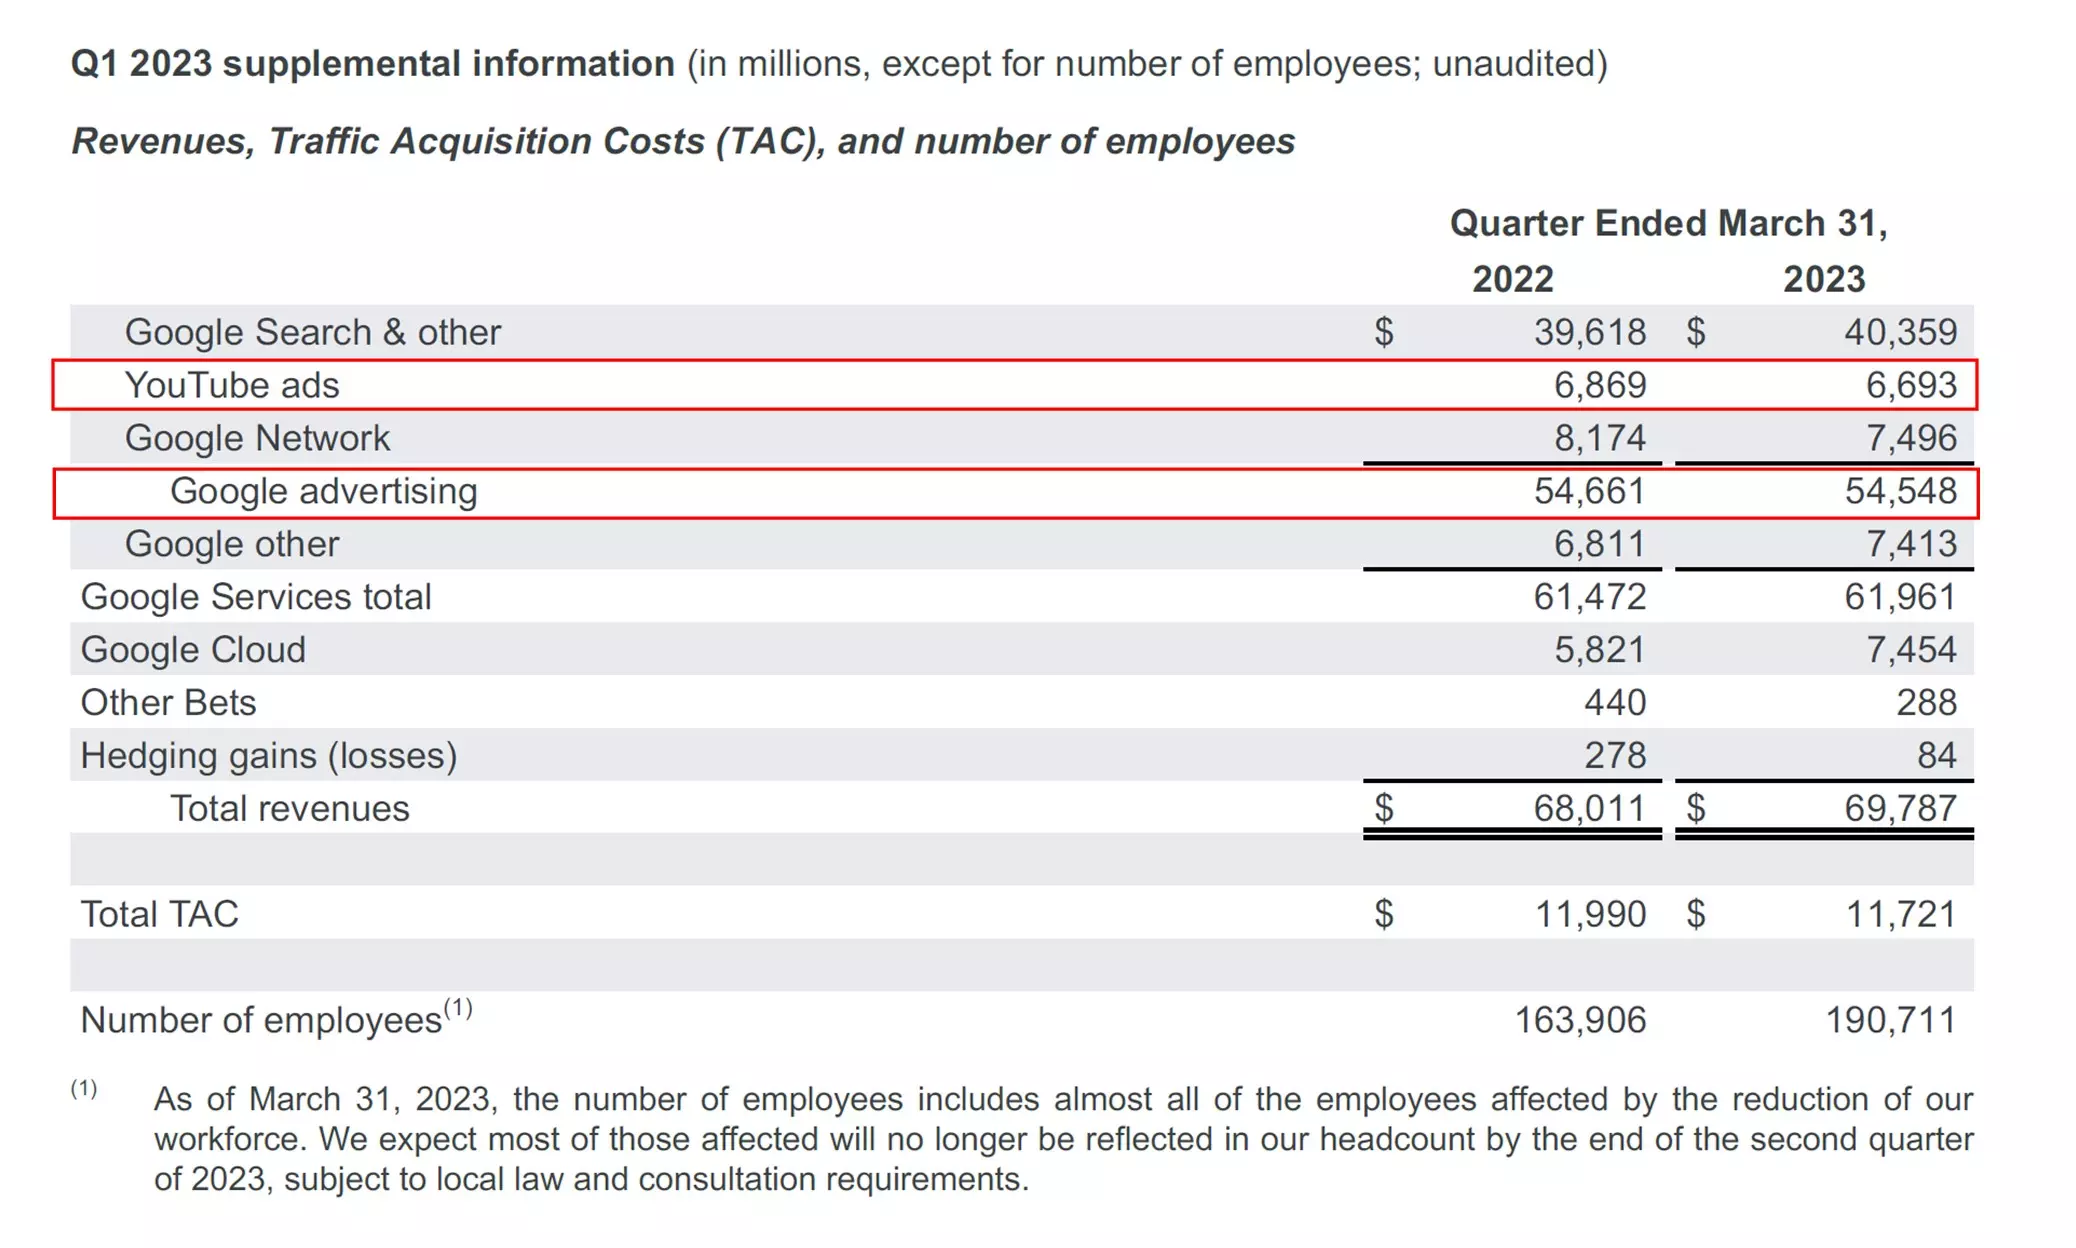
Despite beating the market's expectations in the previous quarter, advertising income, which is the major source of revenue for Alphabet, dropped for the second straight quarter.
YouTube advertising revenues were down 3%, while network advertising revenues were down 8%, reflecting the ongoing headwind in the online advertising space. For the quarter to be reported, whether or not Alphabet could reverse the downtrend would be the first key area to closely watch.
Google Cloud
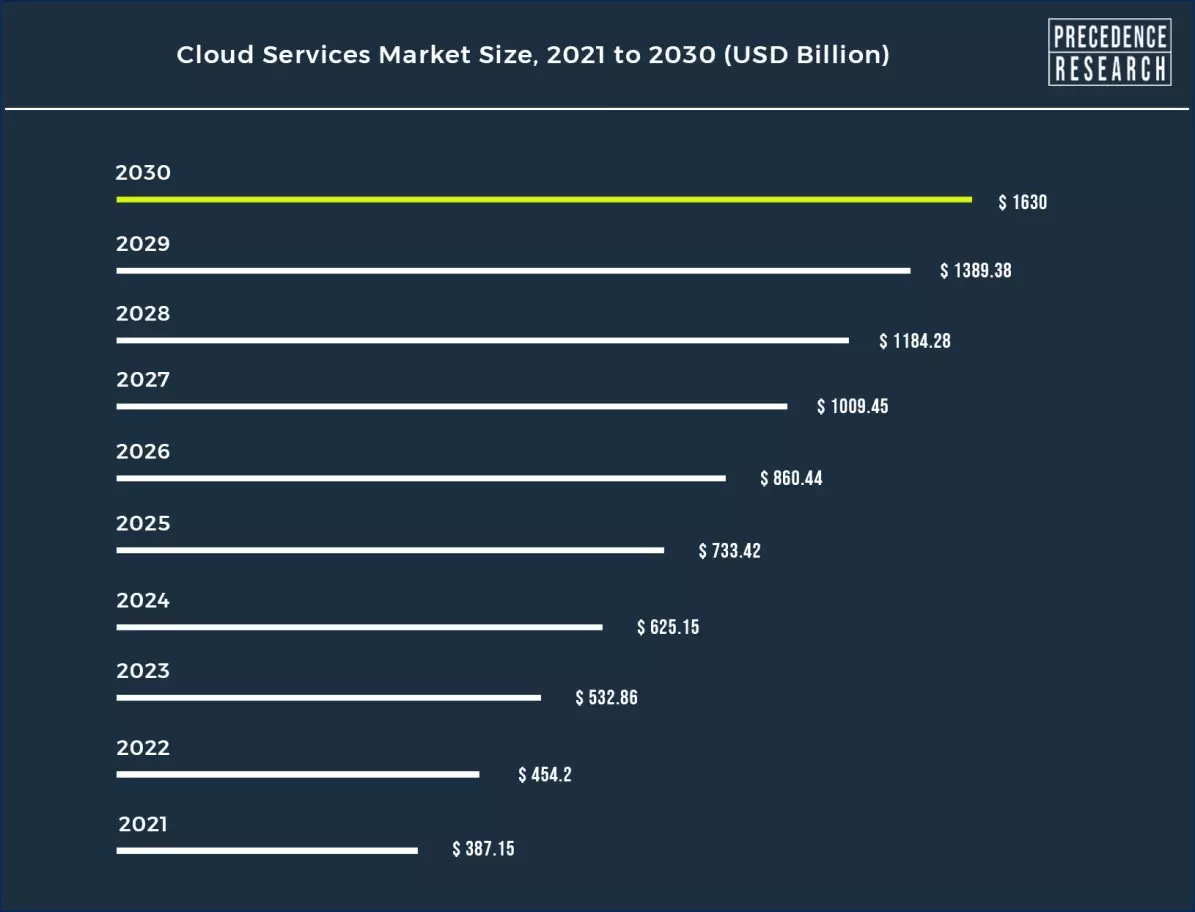
The cloud service is one of the fastest-growing areas that all tech giants can't afford to miss. According to Precedence Research, the global cloud service market is projected to grow 20% annually through 2030 and reach US$1630 Billion.
In this space, Amazon, the first mover in the industry, currently secures an estimated 32% of the global market share. However, Google Cloud is rapidly catching up as the fastest-growing player. Google’s cloud business has finally turned profitable in the previous quarter, reaching an operating income of $191 million and an operating margin of 2.6%.
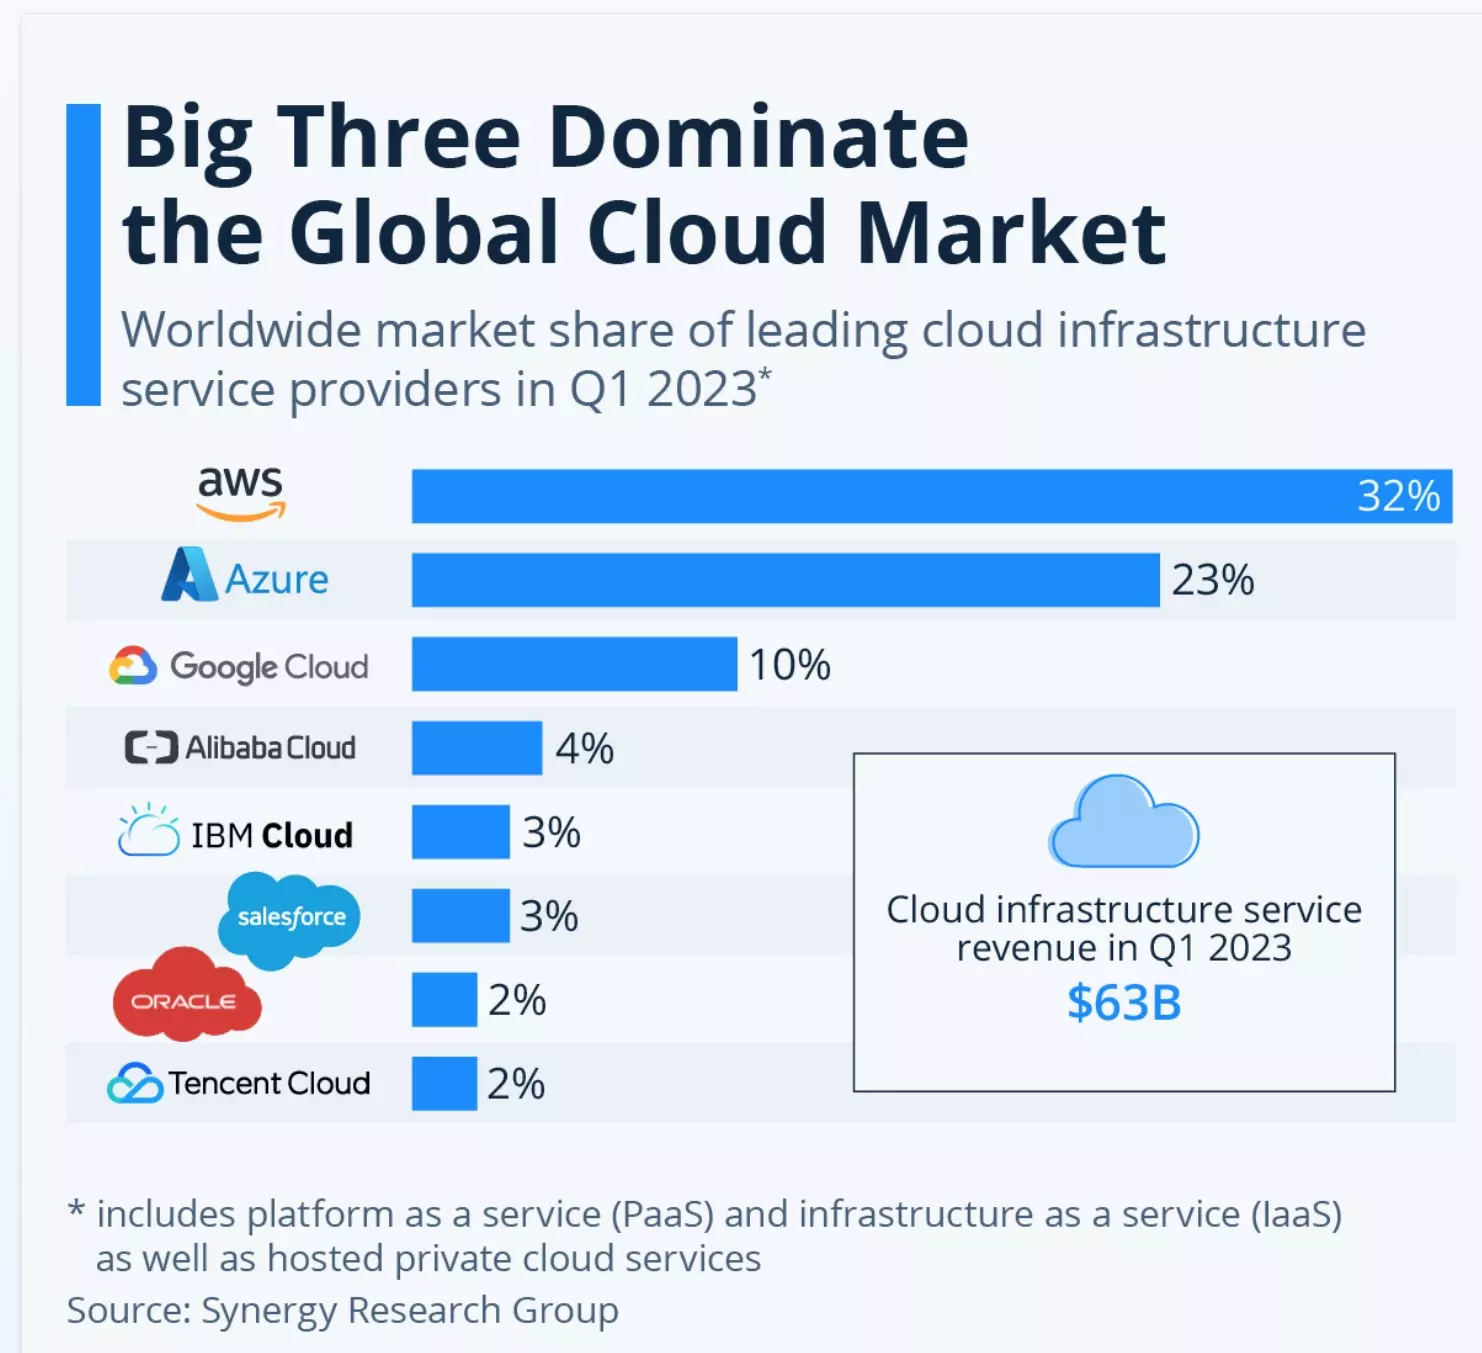
However, the path ahead won’t be any easier for Google as its market share remains lagging behind Amazon and Microsoft by a fair distance. Moreover, the growth rate for Alphabet’s cloud business has notably slowed down, decreasing from 40% in 2022 to less than 30% in Q1 2023. As such, whether or not Google Cloud could sustain its hard-earned profitability and continue narrowing the market share gap with the other two strong competitors will be another must-watch.
Google DeepMind
Google DeepMind, combining the Brain Team from Google Research with DeepMind, will be listed as an individual sector for the first time in the Q2 report, highlighting Alphabet's ambition to accelerate its artificial intelligence (AI) innovation and impact. While the move is not likely to materially impact the final earnings for the to-be-reported quarter, the new structure should help investors get a glimpse of the company’s development and cost efficiency on the new technology front.
Additionally, since Microsoft's ChatGPT exploded onto the scene early this year, the global tech industry has been swept up in an AI battlefield as a platform-changing era seemingly unfolds. As for Alphabet, its longstanding dominance in the search engine realm is facing a new challenge.
With the addition of powerful AI features, Microsoft's Bing is making a comeback. Although Alphabet rushed to present its own AI version of a search engine called 'Bart,' it seems to be lacking the same level of excitement so far. As such, investors will be keen to find out any progress in the AI territory that Alphabet is going to present to defend its crown as the search engine king.
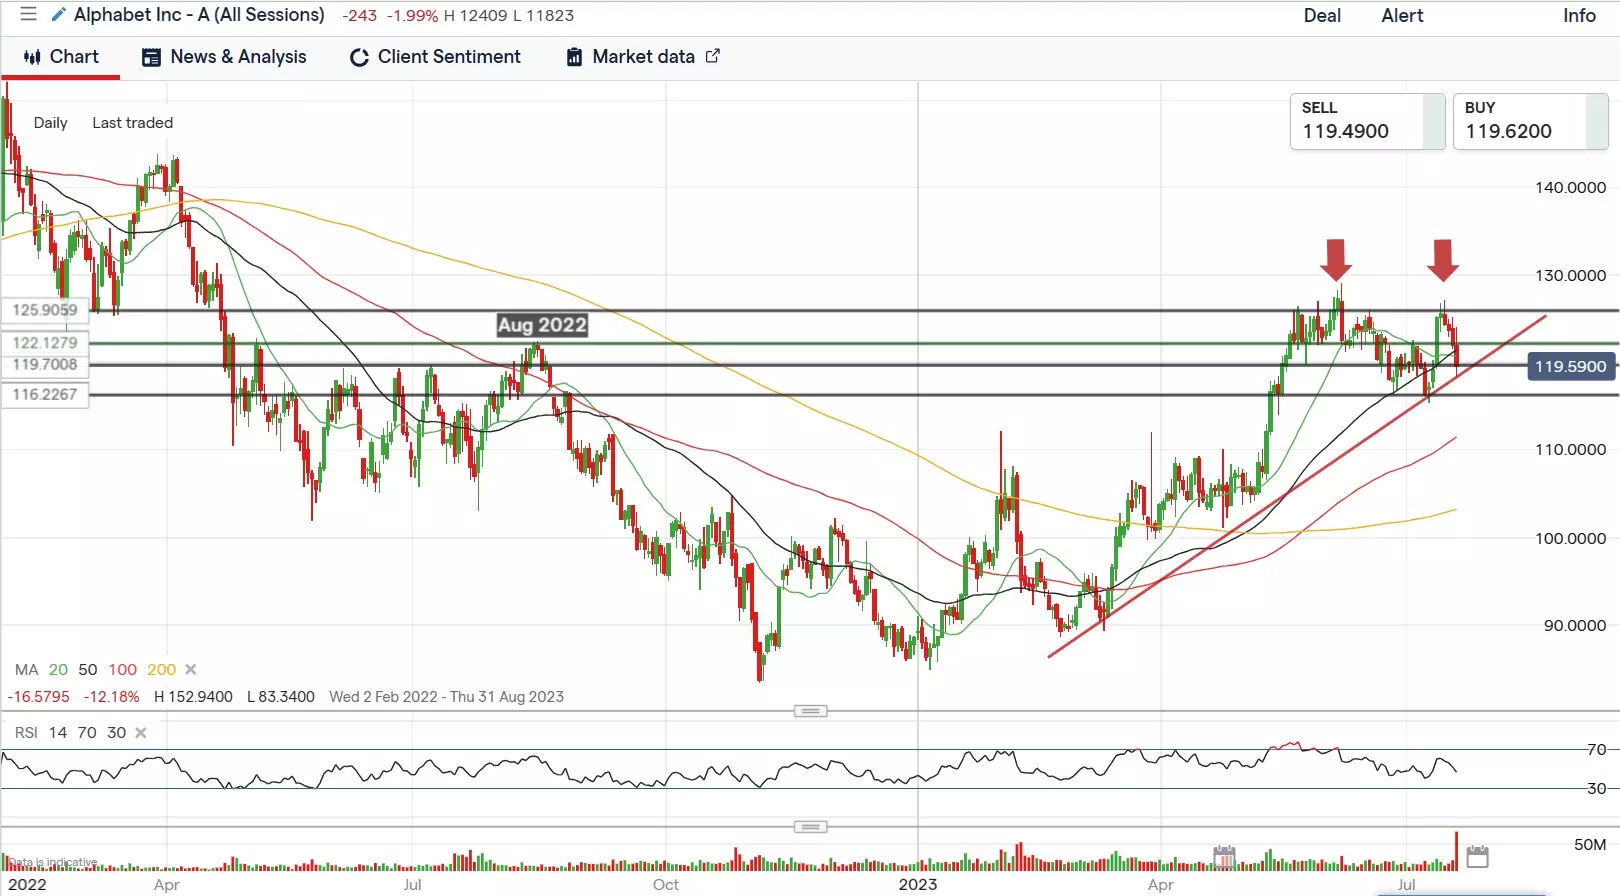
Alphabet Q2 Earnings - Technical Analysis
From a technical point of view, Alphabet's more than 30% rally since February 2023 is now approaching a critical juncture.
On the weekly chart, the price is currently supported by the 100-week average. However, it's worth noting that a further decline from this level could effectively breach the 4-month-long trend line, potentially transforming the uptrend line into a new resistance hurdle.
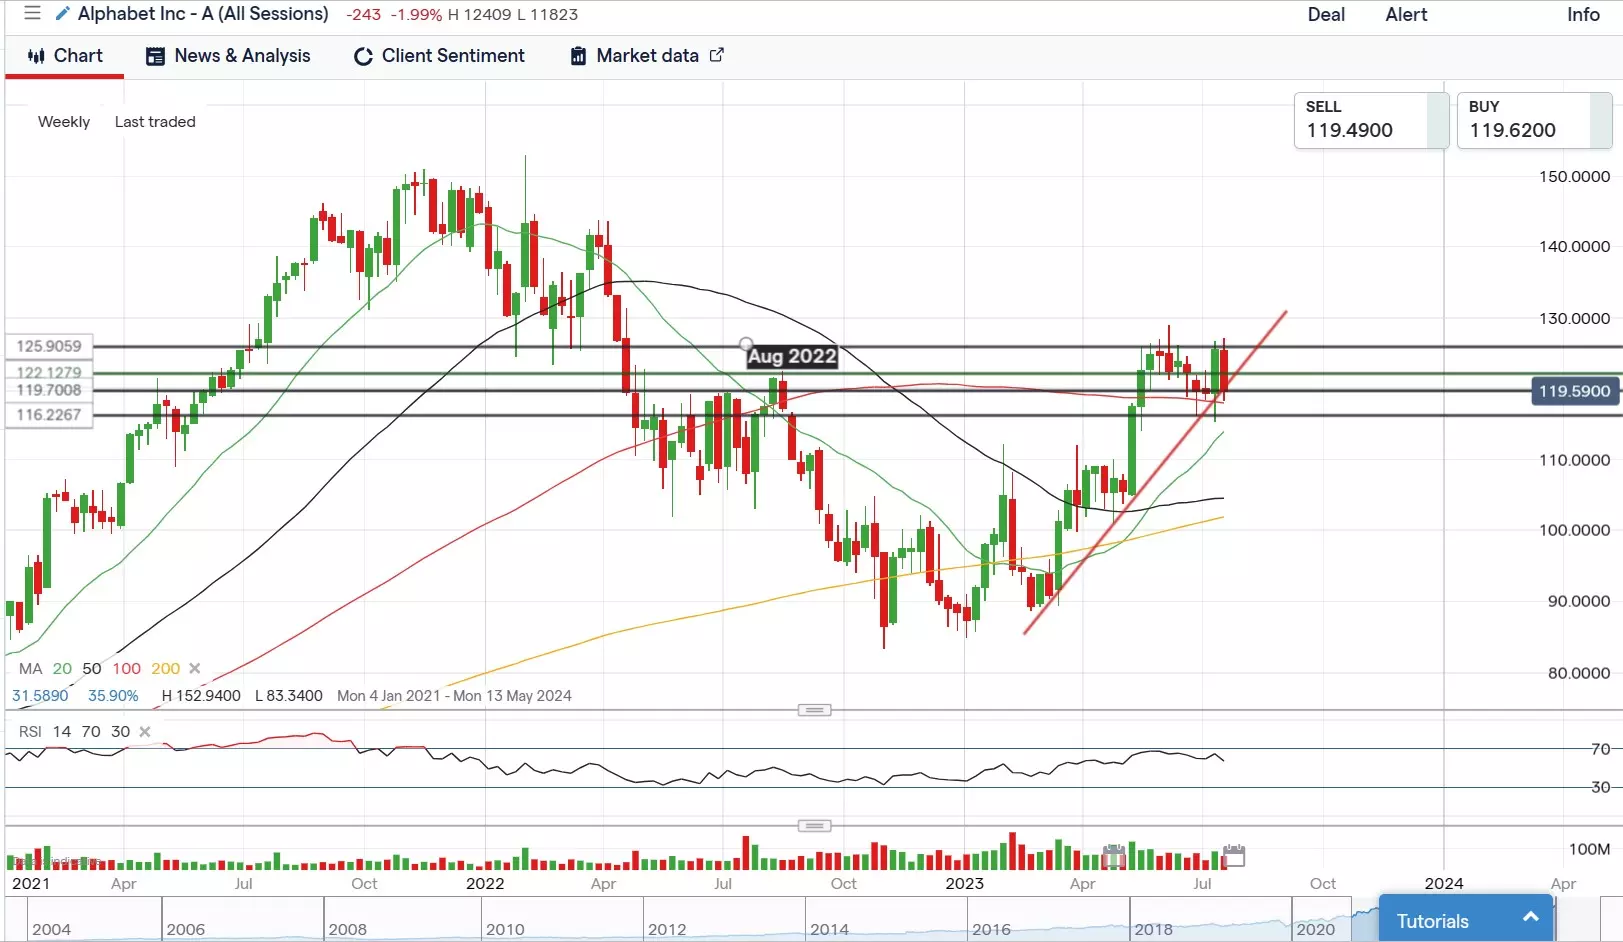
Turning to the daily chart, the next upside target appears to be the August 2022 peak at $122.2, however, the 50-day moving average (MA) will likely present a key challenge in achieving that goal. Immediate support can be found around $119.59, where the mid-term trendline intersects with the peak from June to July 2022. Also notably, the recent pullback in the past week is on the way to form a double-head shape, indicating that a breach of the shoulder line (at $116.20) may trigger a further downtrend.
* https://www.globenewswire.com/en/news-release/2022/06/10/2460529/0/en/Cloud-Services-Market-Size-to-Surpass-US-1630-Billion-By-2030.html
IGA, may distribute information/research produced by its respective foreign affiliates within the IG Group of companies pursuant to an arrangement under Regulation 32C of the Financial Advisers Regulations. Where the research is distributed in Singapore to a person who is not an Accredited Investor, Expert Investor or an Institutional Investor, IGA accepts legal responsibility for the contents of the report to such persons only to the extent required by law. Singapore recipients should contact IGA at 6390 5118 for matters arising from, or in connection with the information distributed.
The information/research herein is prepared by IG Asia Pte Ltd (IGA) and its foreign affiliated companies (collectively known as the IG Group) and is intended for general circulation only. It does not take into account the specific investment objectives, financial situation, or particular needs of any particular person. You should take into account your specific investment objectives, financial situation, and particular needs before making a commitment to trade, including seeking advice from an independent financial adviser regarding the suitability of the investment, under a separate engagement, as you deem fit.
No representation or warranty is given as to the accuracy or completeness of this information. Consequently, any person acting on it does so entirely at their own risk. Please see important Research Disclaimer.
Please also note that the information does not contain a record of our trading prices, or an offer of, or solicitation for, a transaction in any financial instrument. Any views and opinions expressed may be changed without an update.

Seize a share opportunity today
Go long or short on thousands of international stocks.
- Increase your market exposure with leverage
- Get spreads from just 0.1% on major global shares
- Trade CFDs straight into order books with direct market access
Live prices on most popular markets
- Forex
- Shares
- Indices
See more forex live prices
See more shares live prices
Prices above are subject to our website terms and agreements. Prices are indicative only. All shares prices are delayed by at least 15 mins.
See more indices live prices
Prices above are subject to our website terms and agreements. Prices are indicative only. All shares prices are delayed by at least 20 mins.
