Amazon share price drops on results as electric car investment weighs on earnings
Amazon Inc. results show a quarterly loss due to investment in electric carmaker Rivian.

Amazon reports quarter one (Q1) 2022 loss
Amazon has reported first quarter (Q1) 2022 results which have fallen short of market expectations. A summary of the financial results are as follows:
- Revenue increased to $116.44 billion, +7.3% year on year (YoY)
- Net loss of $3.8 billion compares with net income of $8.1 billion in the prior year’s comparative period
- A diluted loss per share of $7.56 per diluted share compares with earnings per share (EPS) of $15.79 in the prior year’s comparative period
- Negative free cash flow of $18.6 billion for the trailing twelve months (prior year’s comparative was a free cash inflow of $26.4 billion)
Amazon inc. issue weak forward guidance
Amazon Inc. has provided the following guidance in terms of the outlook for the Q2 of 2022:
- Net sales expected to be between $116.0 billion and $121.0 billion +3% to 7% (YoY), expectant of unfavourable impact of exchange rates
- Operating loss of between $1.0 billion and $3.0 billion expected which compares with operating income of $7.7 billion in Q2 2021
- This guidance assumes, among other things, that no additional business acquisitions, restructurings, or legal settlements are concluded.
Comments on results and guidance
Q1 2022 results have shown an unexpectedly weak quarter for the group. The prior year’s Covid-19 pandemic supported earnings in Q1 2022 providing a high base of comparison, but the extent of lost earnings in the Q1 2022 have underperformed even the softest forecasts. The net loss reported for the period is mostly attributed to a pre-tax valuation loss of $7.6 billion recorded for the group’s investment in Rivian Automotive. Rivian represents Amazon’s investment into the electric vehicle manufacturing space. The Rivian share price has fallen around 50% over the reporting quarter.
Adding to the soft first quarter is the negative outlook for the group’s current (Q2 2022) quarter, where an operating loss is again expected. The Rivian investment is likely to weigh further as the share price is currently down another 40% odd since 1 of April.
As we emerge out of the pandemic the ecommerce space is feeling a pinch from a resumption of bricks and mortar retail appetite. Amazon has and is continuing to face pressure on its business through inflation (stemming from labour and logistic / fuels costs) as well as the Ukraine / Russia war and supply chain bottlenecks.
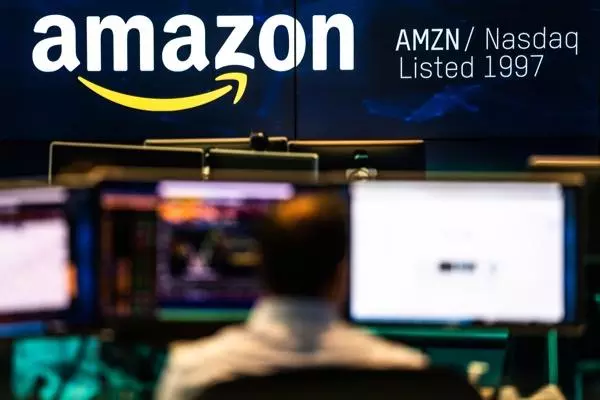
Amazon Inc.

The share price of Amazon Inc. has broken key support at 2720 in afterhours trade following the results release. The long-term trend for the stock remains down as the price continues to trade well below the 200 day simple moving average (SMA). The 20 day SMA is now also crossing the 50 day SMA. This is a suggestion that the short to medium term trend are now also resuming down in line with the longer term trend.
$2460 becomes the initial downside support target from the move lower. Traders who are short might consider using a close above $2720 as a stop loss indication for the trade.
Take your position on over 16,000 local and international shares via CFDs – and trade it all seamlessly from the one account. Learn more about trading share CFDs with us, or open an account to get started today.
IGA, may distribute information/research produced by its respective foreign affiliates within the IG Group of companies pursuant to an arrangement under Regulation 32C of the Financial Advisers Regulations. Where the research is distributed in Singapore to a person who is not an Accredited Investor, Expert Investor or an Institutional Investor, IGA accepts legal responsibility for the contents of the report to such persons only to the extent required by law. Singapore recipients should contact IGA at 6390 5118 for matters arising from, or in connection with the information distributed.
The information/research herein is prepared by IG Asia Pte Ltd (IGA) and its foreign affiliated companies (collectively known as the IG Group) and is intended for general circulation only. It does not take into account the specific investment objectives, financial situation, or particular needs of any particular person. You should take into account your specific investment objectives, financial situation, and particular needs before making a commitment to trade, including seeking advice from an independent financial adviser regarding the suitability of the investment, under a separate engagement, as you deem fit.
No representation or warranty is given as to the accuracy or completeness of this information. Consequently, any person acting on it does so entirely at their own risk. Please see important Research Disclaimer.
Please also note that the information does not contain a record of our trading prices, or an offer of, or solicitation for, a transaction in any financial instrument. Any views and opinions expressed may be changed without an update.

Start trading forex today
Trade the largest and most volatile financial market in the world.
- Spreads start at just 0.6 points on EUR/USD
- Analyse market movements with our essential selection of charts
- Speculate from a range of platforms, including on mobile
Live prices on most popular markets
- Forex
- Shares
- Indices
See more forex live prices
See more shares live prices
Prices above are subject to our website terms and agreements. Prices are indicative only. All shares prices are delayed by at least 15 mins.
See more indices live prices
Prices above are subject to our website terms and agreements. Prices are indicative only. All shares prices are delayed by at least 20 mins.
