As Dow Jones, S&P 500 plunge on Powell testimony, is a larger Fed rate hike next?
Dow Jones, S&P 500 plunge after Jerome Powell testimony; Powell offered an increasingly hawkish view; markets are starting to favor 50-basis point hike this month and Asia-Pacific markets are bracing for volatility on Wednesday.
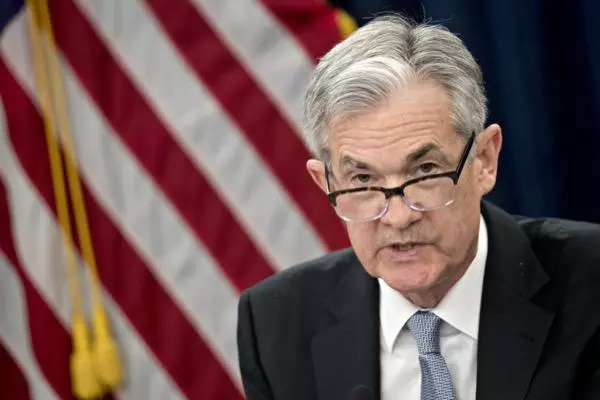

Wall Street received a reality check on Tuesday as the Dow Jones and S&P 500 sank 1.72% and 1.53%, respectively. The key culprit was what traders were anxiously anticipating, testimony from Federal Reserve Chair Jerome Powell before the Senate Banking Committee.
The key takeaway from Mr. Powell was that he noted that the central bank was prepared to speed up the pace of hikes again if warranted. Of course, this would continue to be influenced by incoming economic data. Furthermore, he noted that the Fed is likely looking at a higher rate peak than expected.
This testimony follows recent signs that inflation might be stickier than previously seen. The latest CPI and PCE report (the latter of which is the central bank’s preferred inflationary gauge) showed signs that the pace of disinflation slowed.
By the end of the day, market pricing started to favor a 50-basis point rate hike this month as opposed to 25. Treasury yields soared, sapping the appeal of stocks, inducing classic risk aversion. This leaves Asia-Pacific markets vulnerable heading into Wednesday’s trading session.
Dow Jones technical analysis
The Dow Jones turned lower after rejecting the 50-day Simple Moving Average (SMA). This also followed a breakout under a Symmetrical Triangle chart formation. This is placing the focus on immediate support, which is the 38.2% Fibonacci retracement level at 32709.
Dow Jones daily chart

S&P 500 technical analysis
Meanwhile, the S&P 500 rejected the ceiling of a bearish Rising Wedge chart formation. This is leaving the index also facing the 38.2% Fibonacci retracement level, which here is sitting at 3938.61. Confirming a breakout under the latter would open the door to an increasingly bearish technical bias.
S&P 500 daily chart

This information has been prepared by DailyFX, the partner site of IG offering leading forex news and analysis. In addition to the disclaimer below, the material on this page does not contain a record of our trading prices, or an offer of, or solicitation for, a transaction in any financial instrument. IG accepts no responsibility for any use that may be made of these comments and for any consequences that result. No representation or warranty is given as to the accuracy or completeness of this information. Consequently any person acting on it does so entirely at their own risk. Any research provided does not have regard to the specific investment objectives, financial situation and needs of any specific person who may receive it. It has not been prepared in accordance with legal requirements designed to promote the independence of investment research and as such is considered to be a marketing communication. Although we are not specifically constrained from dealing ahead of our recommendations we do not seek to take advantage of them before they are provided to our clients.
IGA, may distribute information/research produced by its respective foreign affiliates within the IG Group of companies pursuant to an arrangement under Regulation 32C of the Financial Advisers Regulations. Where the research is distributed in Singapore to a person who is not an Accredited Investor, Expert Investor or an Institutional Investor, IGA accepts legal responsibility for the contents of the report to such persons only to the extent required by law. Singapore recipients should contact IGA at 6390 5118 for matters arising from, or in connection with the information distributed.
The information/research herein is prepared by IG Asia Pte Ltd (IGA) and its foreign affiliated companies (collectively known as the IG Group) and is intended for general circulation only. It does not take into account the specific investment objectives, financial situation, or particular needs of any particular person. You should take into account your specific investment objectives, financial situation, and particular needs before making a commitment to trade, including seeking advice from an independent financial adviser regarding the suitability of the investment, under a separate engagement, as you deem fit.
No representation or warranty is given as to the accuracy or completeness of this information. Consequently, any person acting on it does so entirely at their own risk. Please see important Research Disclaimer.
Please also note that the information does not contain a record of our trading prices, or an offer of, or solicitation for, a transaction in any financial instrument. Any views and opinions expressed may be changed without an update.

Explore the markets with our free course
Discover the range of markets you can spread bet on - and learn how they work - with IG Academy's online course.
Turn knowledge into success
Practice makes perfect. Take what you’ve learned in this index strategy article, and try it out risk-free in your demo account.
Ready to trade indices?
Put the lessons in this article to use in a live account. Upgrading is quick and simple.
- Get fixed spreads from 1 point on FTSE 100 and Germany 40
- Protect your capital with risk management tools
- Trade more 24-hour markets than any other provider – 26 in total
Inspired to trade?
Put the knowledge you’ve gained from this article into practice. Log in to your account now.
Live prices on most popular markets
- Forex
- Shares
- Indices
See more forex live prices
See more shares live prices
Prices above are subject to our website terms and agreements. Prices are indicative only. All shares prices are delayed by at least 15 mins.
See more indices live prices
Prices above are subject to our website terms and agreements. Prices are indicative only. All shares prices are delayed by at least 20 mins.
