Asia Day Ahead: USD/JPY firms on Japan’s inflation, silver prices hovering at ten-week high
The economic calendar this morning saw Japan’s October headline inflation move higher to 3.3% from previous 3%, while the core aspect came in lower than expected at 2.9% versus the 3% forecast.


Market Recap
While the US markets were off-trading overnight, European equities continue to edge higher amid lighter volume, with the Europe's benchmark STOXX 600 at a new two-month high. The attention was on a series of European purchasing managers index (PMI) releases on the calendar, which generally turned in higher than consensus, but a continued tread in contractionary territory may still point towards looming recessionary risks.
The US S&P Global PMI figures will be out today, with economic conditions expected to stay subdued as well. Its manufacturing PMI is expected to dip back into minor contraction at 49.8 versus previous 50, while services sector activities may soften to 50.4 from previous 50.6. Softer data may aid to validate current market views for the Federal Reserve (Fed) to keep rates on hold further, while markets continue to bask in the hopes that a recession can still be avoided.
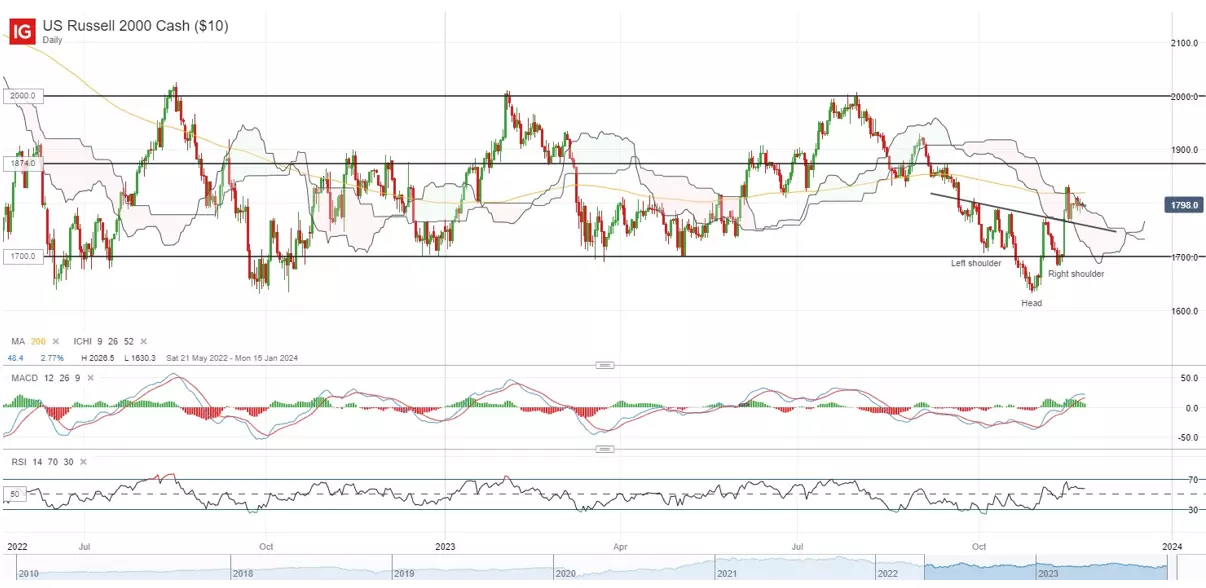
Undoubtedly, markets will be watching on whether the prevailing risk-on environment can roll over into next week. The Russell 2000 index has been stepping up lately, outperforming the DJIA over the past month, but trailing behind the S&P 500 and Nasdaq. A recent break above an inverse head-and-shoulder formation may reflect greater control from buyers lately, but the index will have to overcome an immediate resistance ahead at its 200-day moving average (MA). That trendline marked a key previous support-turned-resistance, with any successful break potentially paving the way to retest the 1,874 level next.
Asia Open
Asian stocks look set for a broadly positive open, with Nikkei +1.05%, ASX +0.38% and KOSPI -0.12% at the time of writing. Yesterday, a late-afternoon rally in Chinese equities allowed the Hang Seng Index (HSI) to reverse out of the red to close 1% higher, as hopes of more stimulus from Beijing brew once again. A more sustained improvement in economic conditions will remain on the radar, given the on-and-off recovery momentum that markets have witnessed from previous rounds of policy support.
The economic calendar this morning saw Japan’s October headline inflation move higher to 3.3% from previous 3%, while the core aspect came in lower than expected at 2.9% versus the 3% forecast. With headline inflation hovering around the 3-3.5% range for the nine straight months, market participants will be watching for any guidance from policymakers on whether they feel more certainty on achieving its pre-condition of sustainable inflation for a policy pivot.
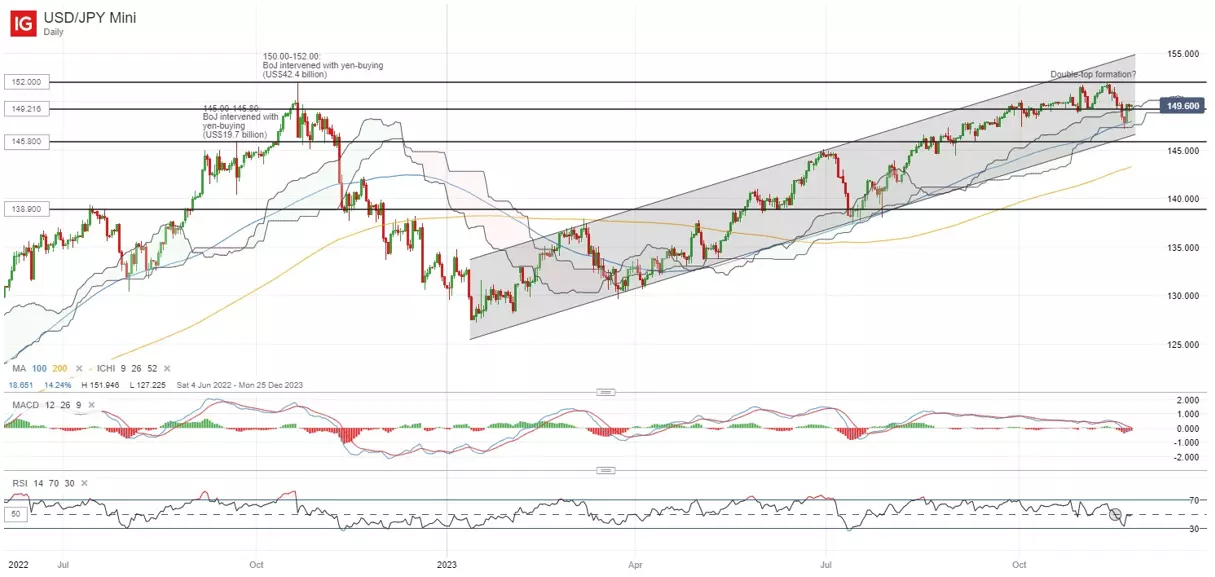
After a breakdown of a near-term double-top neckline at the 149.20 level last week, interaction with the lower edge of the daily Ichimoku cloud support has brought a bounce in the USD/JPY, as dip buyers attempt to keep the broader trend intact. This also marked a bounce off its 100-day MA. Ahead, the Ichimoku cloud support zone has proved to be a crucial support to hold, with greater indications of a broader reversal potentially having to come from a breakdown of the 145.80 level, where the rising channel support since February this year will be invalidated.
On the watchlist: Silver prices consolidating at ten-week high
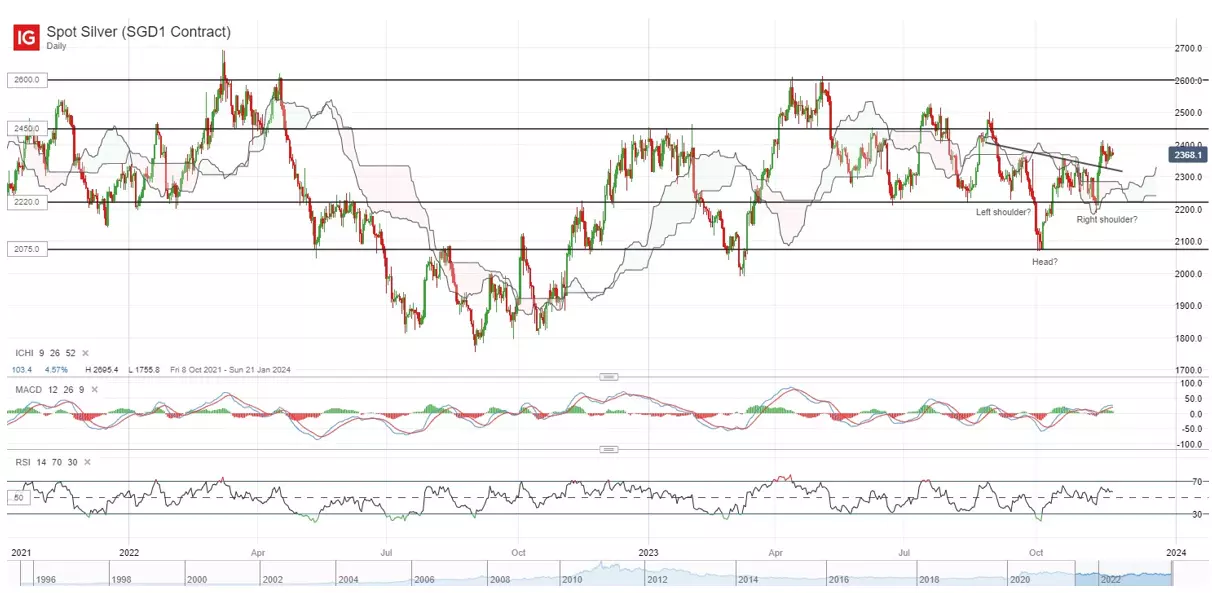
Weakness in the US dollar and lower US Treasury yields have paved the way for silver prices to touch its ten-week high lately, as its daily moving average convergence/divergence (MACD) bounced off its zero level as a sign of building upward momentum. Arguably, recent upside may also mark an upward break of an inverse head-and-shoulder pattern. Ahead, buyers will seek to defend its 200-day MA at the US$23.40 level after reclaiming it successfully last week. Immediate resistance may stand at the US$24.50 level, with any move above it potentially leaving the US$26.00 level on watch next.
Thursday: DJIA +0.53%; S&P 500 +0.41%; Nasdaq +0.46%, DAX +0.23%, FTSE +0.19%
IGA, may distribute information/research produced by its respective foreign affiliates within the IG Group of companies pursuant to an arrangement under Regulation 32C of the Financial Advisers Regulations. Where the research is distributed in Singapore to a person who is not an Accredited Investor, Expert Investor or an Institutional Investor, IGA accepts legal responsibility for the contents of the report to such persons only to the extent required by law. Singapore recipients should contact IGA at 6390 5118 for matters arising from, or in connection with the information distributed.
The information/research herein is prepared by IG Asia Pte Ltd (IGA) and its foreign affiliated companies (collectively known as the IG Group) and is intended for general circulation only. It does not take into account the specific investment objectives, financial situation, or particular needs of any particular person. You should take into account your specific investment objectives, financial situation, and particular needs before making a commitment to trade, including seeking advice from an independent financial adviser regarding the suitability of the investment, under a separate engagement, as you deem fit.
No representation or warranty is given as to the accuracy or completeness of this information. Consequently, any person acting on it does so entirely at their own risk. Please see important Research Disclaimer.
Please also note that the information does not contain a record of our trading prices, or an offer of, or solicitation for, a transaction in any financial instrument. Any views and opinions expressed may be changed without an update.

Seize a share opportunity today
Go long or short on thousands of international stocks.
- Increase your market exposure with leverage
- Get spreads from just 0.1% on major global shares
- Trade CFDs straight into order books with direct market access
Live prices on most popular markets
- Forex
- Shares
- Indices
See more forex live prices
See more shares live prices
Prices above are subject to our website terms and agreements. Prices are indicative only. All shares prices are delayed by at least 15 mins.
See more indices live prices
Prices above are subject to our website terms and agreements. Prices are indicative only. All shares prices are delayed by at least 20 mins.
