Cautiousness returns to European indices
Outlook on FTSE 100, DAX 40 and S&P 500 as recent winning streak ends.


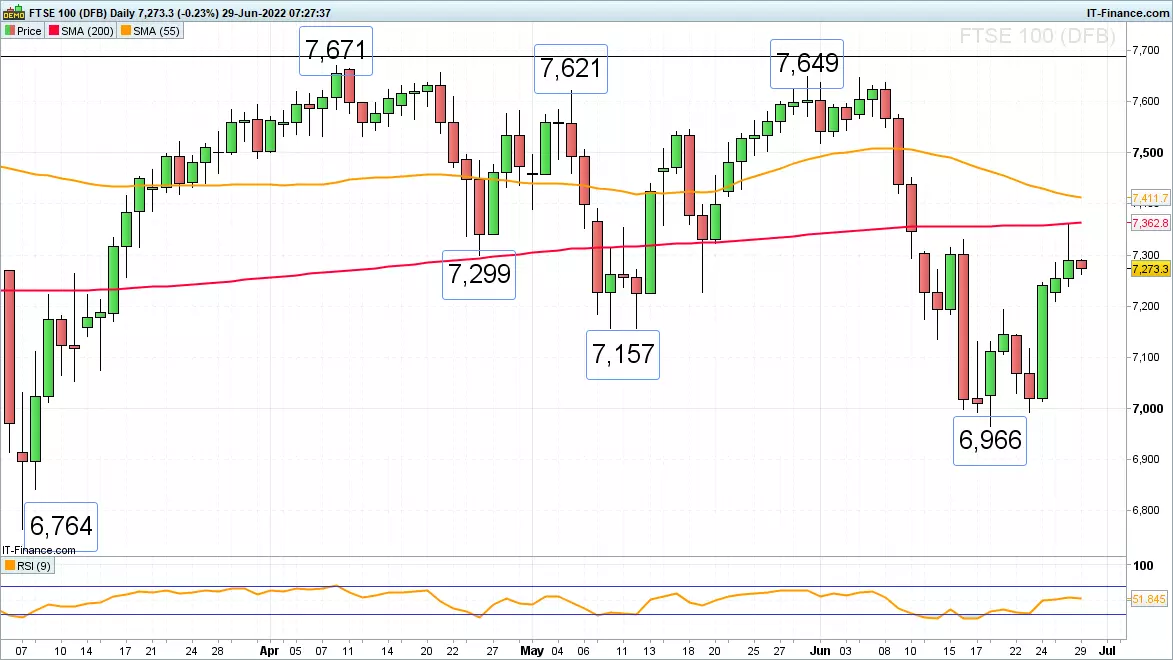
FTSE 100 recovery rally stalls
The FTSE 100 has retreated after having reached and been capped by its 200-day simple moving average (SMA) at 7,362 on Tuesday as UK barristers walked out of courts in strike over pay with further train, tube, bus and airport strikes coming in the summer.
The FTSE 100 is likely to consolidate below the 200-day SMA at 7,362 today with minor support coming in at the 7,226 19 May low. Slightly further down lies the 21 June high at 7,193.
Despite today’s setback a short-term bottom has been confirmed by Friday’s bullish reversal with the 55-day SMA at 7,411 remaining in focus.
DAX still trying to stabilise
The DAX 40 remains below last week’s high at 13,444 but above its recent lows at 12,944 to 12,839 as economic concerns continue to weigh on sentiment and disappointing US consumer confidence data weigh on the index.
Since last week’s low has not been accompanied by a negative reading of the daily 9-period Relative Strength Index (RSI), positive divergence can still be made out on the daily candlestick chart. This increases the odds of a bullish reversal taking shape, but for this to happen, a rise and daily chart close above the 21 June high at 13,444 will need to be witnessed. Ideally the mid-June high at 13,676, which was made within the 13,681 to 13,743 gap, should be overcome as well.
A fall through last week’s low at 12,839 on a daily chart closing basis could lead to the March low at 12,432 being revisited.

S&P 500 retreats on disappointing consumer confidence index reading
The S&P 500’s recovery rally from its 3,636 current mid-June low has taken it to yesterday’s high at 3,946 before the index swiftly came off again as the US consumer confidence index came in at a weaker than expected reading of 98.7 for June compared to estimates of between 100 to 103 and versus the previous month’s revised 103.2 (from 106.40).
The 3,811 May low is thus back within reach but may offer short-term support. If not, we would have to allow for the 14 June low at 3,706 to perhaps be back in play.
While last Wednesday’s low at 3,690 underpins, however, renewed upside could be seen. Failure at 3,690 on a daily chart closing basis would put the current June low at 3,636 back on the plate, though. 

IGA, may distribute information/research produced by its respective foreign affiliates within the IG Group of companies pursuant to an arrangement under Regulation 32C of the Financial Advisers Regulations. Where the research is distributed in Singapore to a person who is not an Accredited Investor, Expert Investor or an Institutional Investor, IGA accepts legal responsibility for the contents of the report to such persons only to the extent required by law. Singapore recipients should contact IGA at 6390 5118 for matters arising from, or in connection with the information distributed.
The information/research herein is prepared by IG Asia Pte Ltd (IGA) and its foreign affiliated companies (collectively known as the IG Group) and is intended for general circulation only. It does not take into account the specific investment objectives, financial situation, or particular needs of any particular person. You should take into account your specific investment objectives, financial situation, and particular needs before making a commitment to trade, including seeking advice from an independent financial adviser regarding the suitability of the investment, under a separate engagement, as you deem fit.
No representation or warranty is given as to the accuracy or completeness of this information. Consequently, any person acting on it does so entirely at their own risk. Please see important Research Disclaimer.
Please also note that the information does not contain a record of our trading prices, or an offer of, or solicitation for, a transaction in any financial instrument. Any views and opinions expressed may be changed without an update.

Take a position on indices
Deal on the world’s major stock indices today.
- Trade the lowest Wall Street spreads on the market
- 1-point spread on the FTSE 100 and Germany 40
- The only provider to offer 24-hour pricing
Live prices on most popular markets
- Forex
- Shares
- Indices
See more forex live prices
See more shares live prices
Prices above are subject to our website terms and agreements. Prices are indicative only. All shares prices are delayed by at least 15 mins.
See more indices live prices
Prices above are subject to our website terms and agreements. Prices are indicative only. All shares prices are delayed by at least 20 mins.
