De-risking ahead of Fed Chair’s Jackson Hole speech: Brent crude, AUD/JPY, EUR/USD
Nvidia’s stellar results hit with a sell-the-news market reaction, as market participants de-risk ahead of Fed Chair Jerome Powell’s Jackson Hole speech later tonight.


Market Recap
Initial gains in Wall Street reversed sharply overnight, with Nvidia's stellar results hit with a sell-the-news market reaction, as market participants de-risk ahead of Federal Reserve (Fed) Chair Jerome Powell’s Jackson Hole speech later tonight. The VIX was up 7.6% as a reflection of increased hedging activities, while market sentiments (from the CNN Fear and Greed Index) have fallen back into ‘fear’ territory for the first time since March this year.
No doubt the Fed’s policy outlook will be the key driving force for markets ahead. With fresh updates on US inflation and labour market data after the previous Federal Open Market Committee (FOMC) meeting, focus will be on what factors the Fed Chair will have his attention on. Maintaining his emphasis on the Fed’s data-dependent stance and bringing up progress in US inflation may potentially be perceived as a less hawkish view, but on the other hand, highlighting the risks of a reacceleration in demand and the need for high-for-longer rates will likely be a more hawkish message.
For now, expectations remain firmly priced for rates to be kept on hold in September, but the probability for a November hike has increased to the current 41%, from 32% just a month ago. Treasury yields firmed overnight, following an earlier sell-off on Wednesday, while the US dollar is back at its two-month high, as some positioning for a hawkish takeaway gets underway.
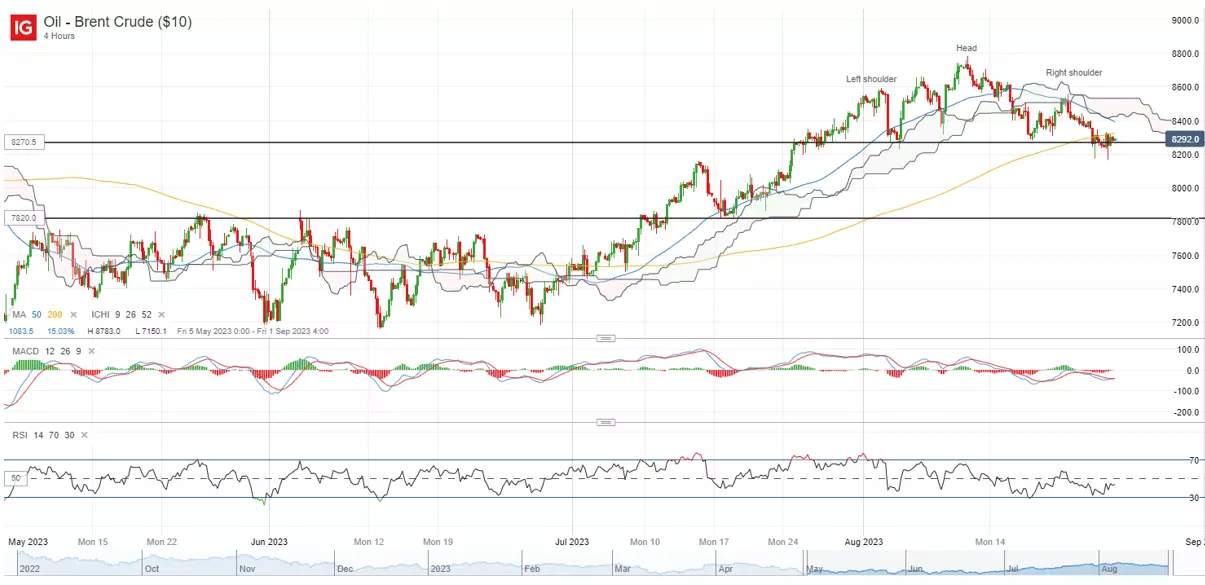
Perhaps one to watch may be Brent crude prices, which saw dip buyers attempting to defend the neckline of a head-and-shoulder formation (four-hour chart), with the formation of a series of long-legged pin bars overnight. Greater conviction may have to come from a move back above its shoulders at the 85.40 level, where the upper edge of its Ichimoku cloud resistance (four-hour) may have to be overcome as well. On the other hand, price projection from any breakdown of the head-and-shoulder neckline at the 82.70 level could leave the 78.20 level on watch next.
Asia Open
Asian stocks look set for a negative open, with Nikkei -1.55%, ASX -1.05% and KOSPI -0.81% at the time of writing. The rush for market participants to further de-risk ahead of Fed Chair Jerome Powell’s comments has spilled over to the Asia session, given that the previous Fed minutes did not reflect the level of unity among policymakers for a rate pause as what many have expected.
The Nasdaq Golden Dragon China Index is down 0.7% overnight, which may challenge the rebound in Chinese equities from oversold technical levels in the earlier session. The formation of lower highs and lows in the Hang Seng Index year-to-date, along with its weekly relative strength index (RSI) failing to sustain above the 50 level for the third time this year may still call for more wait-and-see.
On the economic calendar, this morning saw the release of Tokyo’s August Consumer Price Index (CPI) data, with moderating headline inflation (2.9% versus previous 3.2%) but a further uptick in the ‘core-core’ aspect (2.6% versus previous 2.5%) providing a mixed view overall. That did not trigger too much of a reaction in the USD/JPY, with the pair taking its lead from US dollar strength on mounting hawkish Fed views.
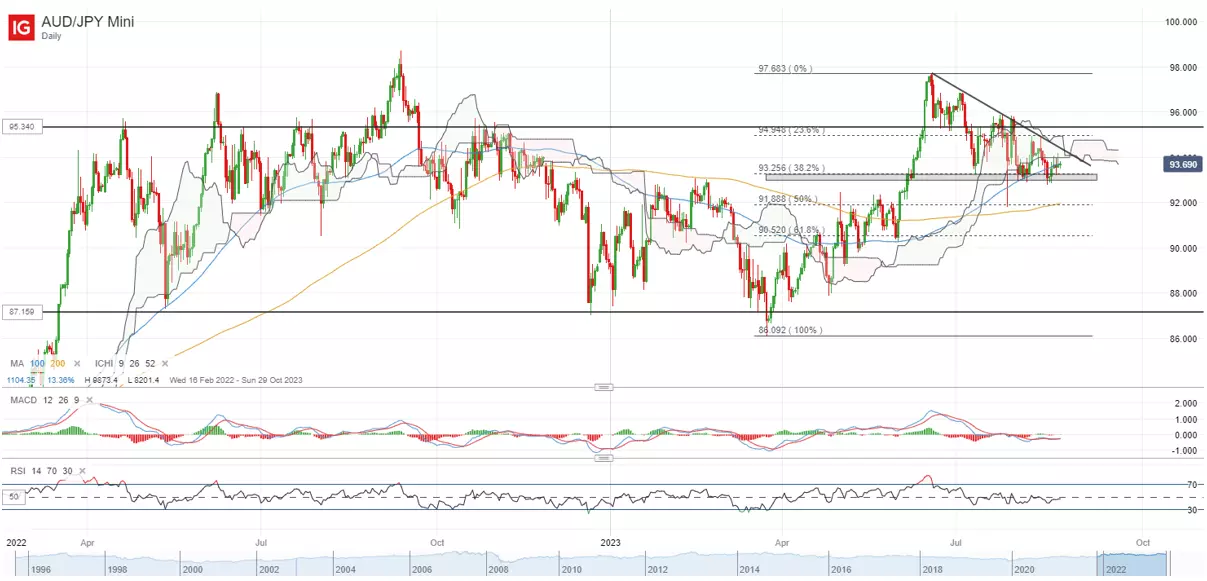
Aside, the AUD/JPY seems to be trading on a near-term descending triangle, with the formation of lower highs and the triangle base around the 93.00 level. Arguably, the recent retracement to a 38.2% Fibonacci level from its March 2023 bottom to June 2023 peak may also leave some hopes on a broader bullish pennant formation. The 93.00 level may be an immediate support level to hold, failing which could pave the way to retest the 91.80 level next, where strong dip-buying off a 50% Fibonacci retracement level was sighted on 28 July 2023. On the upside, the downward trendline resistance will be a key line to overcome, with greater conviction probably having to come from a move back above the 95.34 level.
On the watchlist: 200-day MA for EUR/USD in the crosshair
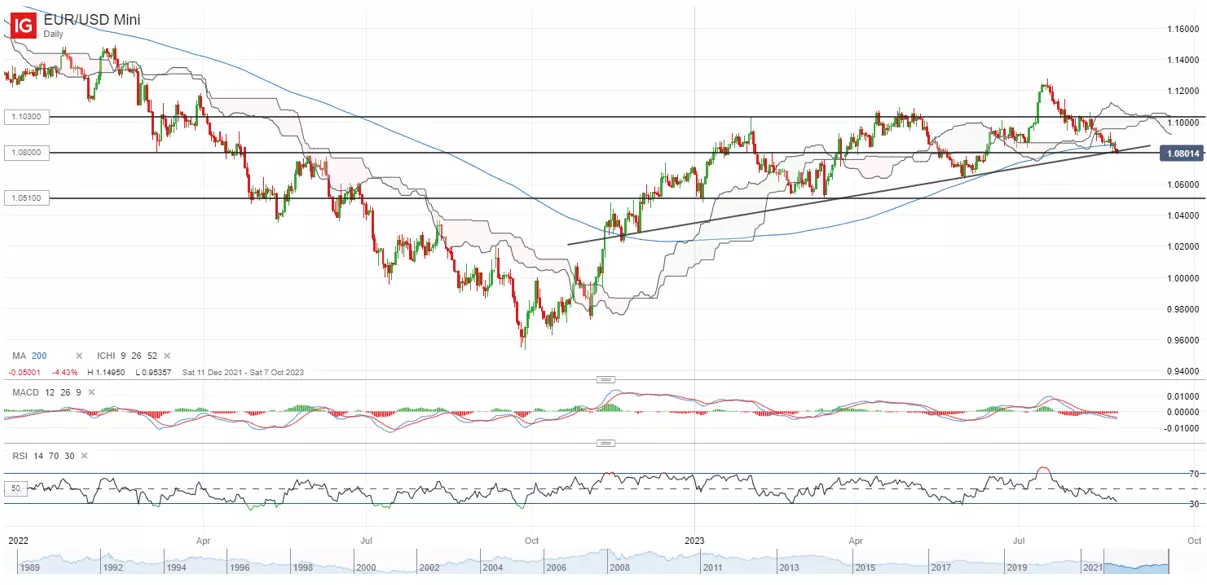
Strength in the US dollar overnight has kept the EUR/USD under pressure, with the pair pushing to a new two-month low and leaving its 200-day moving average (MA) under threat of a breakdown. Its weekly RSI is also back to retest the key 50 level for the third time this year, with any failure to defend the MA-line over the coming days likely to leave sellers in greater control.
For now, the 1.080 level seems like an immediate key support to hold. Any subsequent move below the 1.080 level may potentially pave the way towards the 1.063 level next, which will also mark the first time where the pair trades below its 200-day MA since November 2022.
Thursday: DJIA -1.08%; S&P 500 -1.35%; Nasdaq -1.87%, DAX -0.68%, FTSE +0.18%
IGA, may distribute information/research produced by its respective foreign affiliates within the IG Group of companies pursuant to an arrangement under Regulation 32C of the Financial Advisers Regulations. Where the research is distributed in Singapore to a person who is not an Accredited Investor, Expert Investor or an Institutional Investor, IGA accepts legal responsibility for the contents of the report to such persons only to the extent required by law. Singapore recipients should contact IGA at 6390 5118 for matters arising from, or in connection with the information distributed.
The information/research herein is prepared by IG Asia Pte Ltd (IGA) and its foreign affiliated companies (collectively known as the IG Group) and is intended for general circulation only. It does not take into account the specific investment objectives, financial situation, or particular needs of any particular person. You should take into account your specific investment objectives, financial situation, and particular needs before making a commitment to trade, including seeking advice from an independent financial adviser regarding the suitability of the investment, under a separate engagement, as you deem fit.
No representation or warranty is given as to the accuracy or completeness of this information. Consequently, any person acting on it does so entirely at their own risk. Please see important Research Disclaimer.
Please also note that the information does not contain a record of our trading prices, or an offer of, or solicitation for, a transaction in any financial instrument. Any views and opinions expressed may be changed without an update.

Seize a share opportunity today
Go long or short on thousands of international stocks.
- Increase your market exposure with leverage
- Get spreads from just 0.1% on major global shares
- Trade CFDs straight into order books with direct market access
Live prices on most popular markets
- Forex
- Shares
- Indices
See more forex live prices
See more shares live prices
Prices above are subject to our website terms and agreements. Prices are indicative only. All shares prices are delayed by at least 15 mins.
See more indices live prices
Prices above are subject to our website terms and agreements. Prices are indicative only. All shares prices are delayed by at least 20 mins.
