EUR/USD, AUD/USD and GBP/USD slip on appreciating greenback
Outlook on EUR/USD, AUD/USD and GBP/USD as the U.S. dollar appreciates ahead of Thursday’s Jackson Hole symposium.


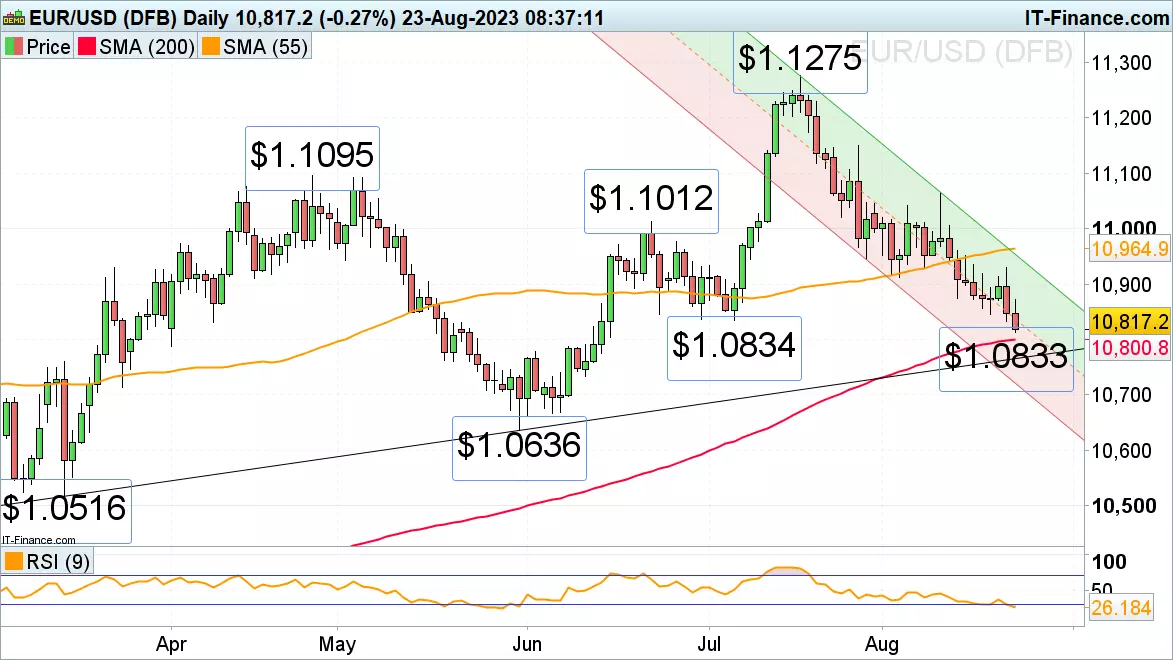
EUR/USD continues its descent
EUR/USD’s decline from its $1.1275 July peak is taking it towards the 200-day simple moving average (SMA) at $1.0801 as the greenback continues to appreciate. Around it the cross may well stabilize.
The retreat in the US 10-year Treasury yield from its 16-year high at 4.366% doesn’t seem to affect the US dollar’s advance but perhaps Eurozone manufacturing and services flash purchasing managers index (PMI) readings for August may do so later today.
Immediate resistance can be seen at last week’s low at $1.0845 with the next higher possible minor resistance levels sitting at the early-August low at $1.0912 and Tuesday’s peak at $1.093.
Below the 200-day SMA potential support can be found along the March-to-August tentative support line at $1.0765.
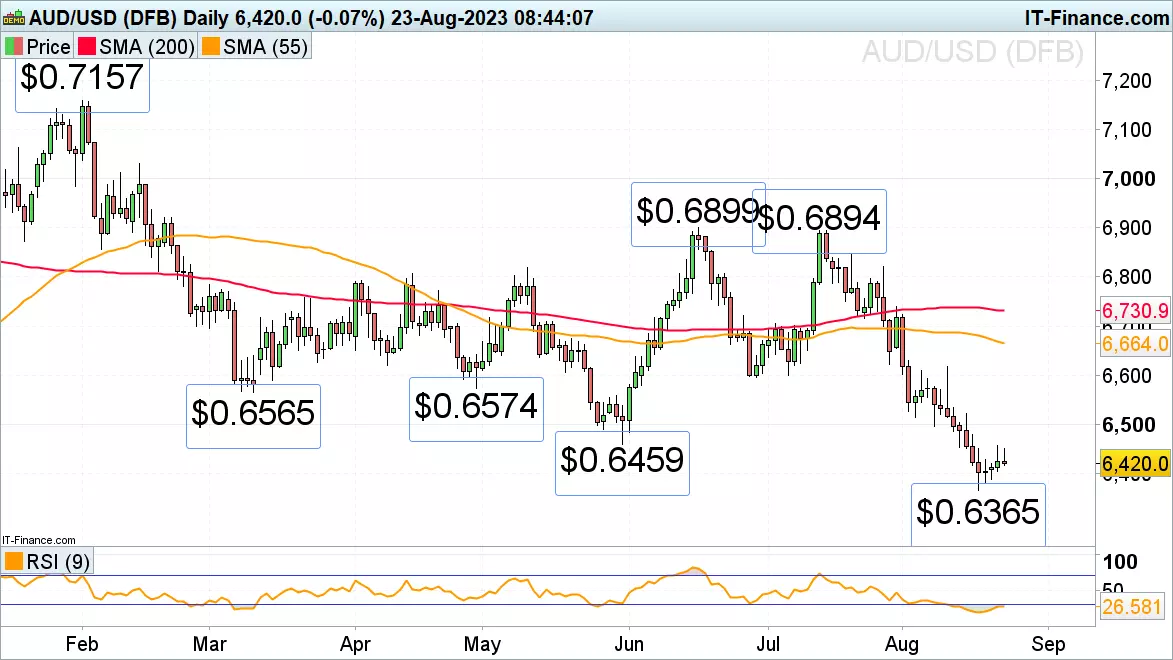
AUD/USD’s recovery from its near ten-month low is running out of puff
AUD/USD's bounce off its near ten-month low at $0.6365 has been lacklustre and has so far only taken the cross to Tuesday’s $0.6457 high.
Wednesday morning’s manufacturing and services flash PMI data for August, both of which came in lower than in July, put a dampener on proceedings with the currency pair slipping once more.
Support below Tuesday’s low at $0.6404 sits at last week’s $0.6365 low. If slipped through, the mid-October high at $0.6348 would be next in line, followed by the November low at $0.6273.
Minor resistance above Tuesday’s high and the May low at $0.6457 to $0.6459 is seen at the late May low at $0.649.
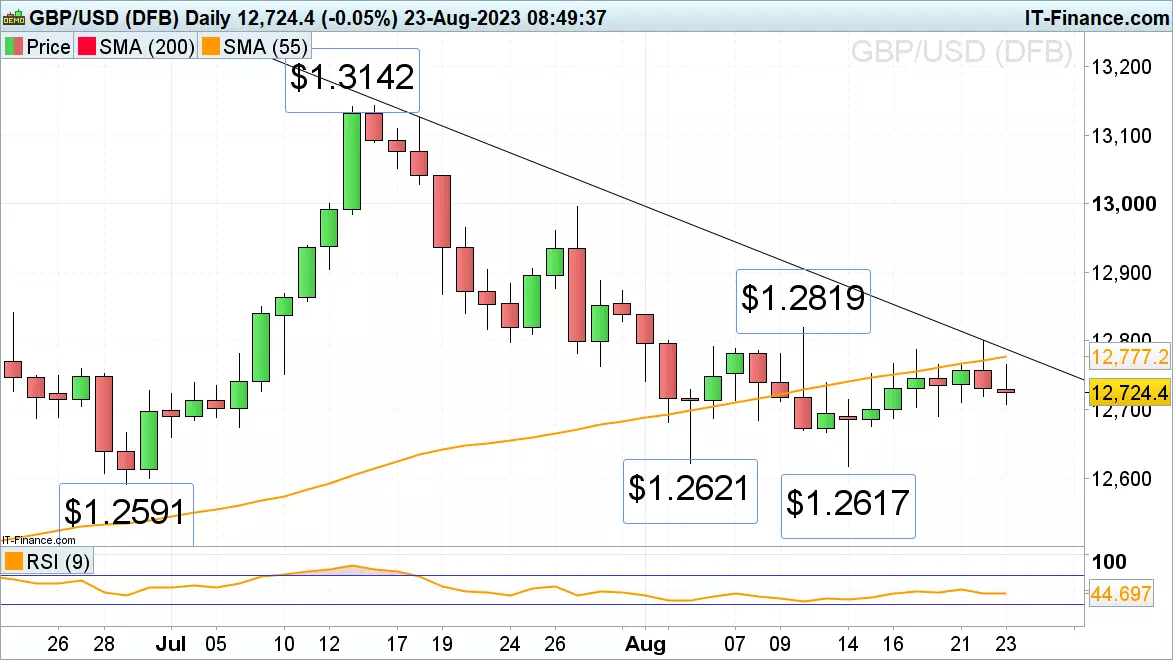
GBP/USD loses upside momentum
GBP/USD gradual advance from its current August low at $1.2617 seems to have run out of steam at Tuesday’s $1.28 peak amid the publication of UK manufacturing and services flash PMIs for August.
Friday’s low at $1.269 may thus be revisited, a drop through which would most likely put the early- and mid-August lows at $1.2621 to $1.2617 back on the map.
Resistance is to be seen between the 55-day SMA at $1.2777 and the July-to-August downtrend line at $1.2787.
While the cross remains below Tuesday’s high at $1.2800, medium-term downside pressure retains the upper hand.
IGA, may distribute information/research produced by its respective foreign affiliates within the IG Group of companies pursuant to an arrangement under Regulation 32C of the Financial Advisers Regulations. Where the research is distributed in Singapore to a person who is not an Accredited Investor, Expert Investor or an Institutional Investor, IGA accepts legal responsibility for the contents of the report to such persons only to the extent required by law. Singapore recipients should contact IGA at 6390 5118 for matters arising from, or in connection with the information distributed.
The information/research herein is prepared by IG Asia Pte Ltd (IGA) and its foreign affiliated companies (collectively known as the IG Group) and is intended for general circulation only. It does not take into account the specific investment objectives, financial situation, or particular needs of any particular person. You should take into account your specific investment objectives, financial situation, and particular needs before making a commitment to trade, including seeking advice from an independent financial adviser regarding the suitability of the investment, under a separate engagement, as you deem fit.
No representation or warranty is given as to the accuracy or completeness of this information. Consequently, any person acting on it does so entirely at their own risk. Please see important Research Disclaimer.
Please also note that the information does not contain a record of our trading prices, or an offer of, or solicitation for, a transaction in any financial instrument. Any views and opinions expressed may be changed without an update.

Start trading forex today
Trade the largest and most volatile financial market in the world.
- Spreads start at just 0.6 points on EUR/USD
- Analyse market movements with our essential selection of charts
- Speculate from a range of platforms, including on mobile
Live prices on most popular markets
- Forex
- Shares
- Indices
See more forex live prices
See more shares live prices
Prices above are subject to our website terms and agreements. Prices are indicative only. All shares prices are delayed by at least 15 mins.
See more indices live prices
Prices above are subject to our website terms and agreements. Prices are indicative only. All shares prices are delayed by at least 20 mins.
