EUR/USD, GBP/USD and AUD/USD stabilize after recent losses
EUR/USD, GBP/USD and AUD/USD stabilize after a period of declines, but will we see the price reverse upwards or maintain the bearish trend?
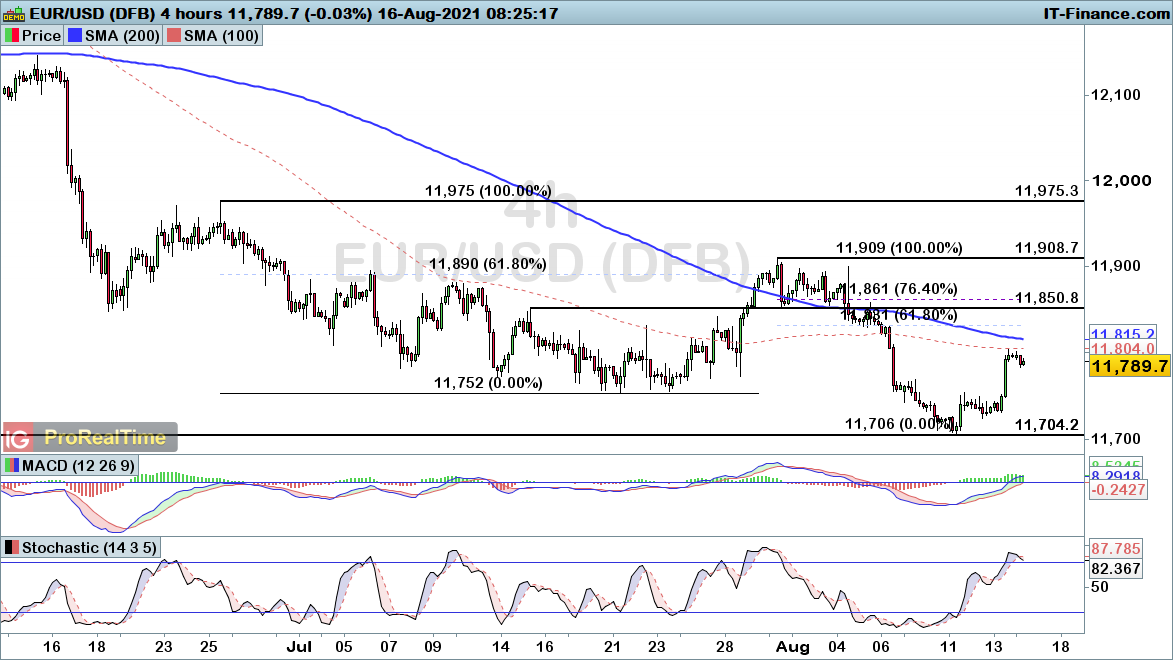
EUR/USD on the rise from key support
EUR/USD has started to regain ground after falling back into the March low of $1.1704. The recent trend of lower highs does still remain in play, unless the price rises through the $1.1909 resistance level from late-July.
With that in mind, there is a risk we could see the pair falter once again. Ultimately, the outlook will become clearer once the price breaks through either $1.1704 or $1.1909. Until then, we could see further short-term upside, yet Fibonacci resistance at $1.1831 and $1.1861 provides the key resistance levels to note up ahead.
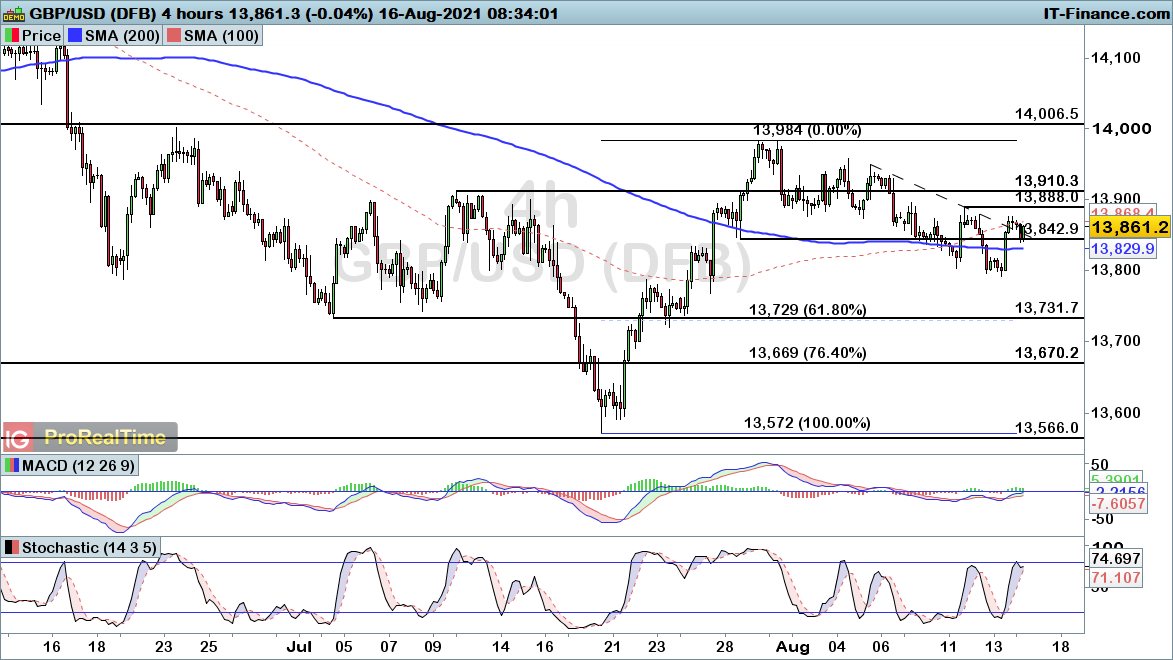
GBP/USD rising back towards notable resistance
GBP/USD has been on the slide over the course of the past fortnight, with the pair seemingly providing a retracement phase in the wake of the rise through $1.391 resistance.
That break points towards us reversing upwards before long, with an end to this intraday trend of lower highs key to that happening. As such, a break through $1.3888 would bring about a fresh bullish signal for the pair. There is still a good chance of further downside unless the price breaks through $1.3888. Should we see the price rise through that level, it would provide a signal that we will regain a more bullish footing once again.
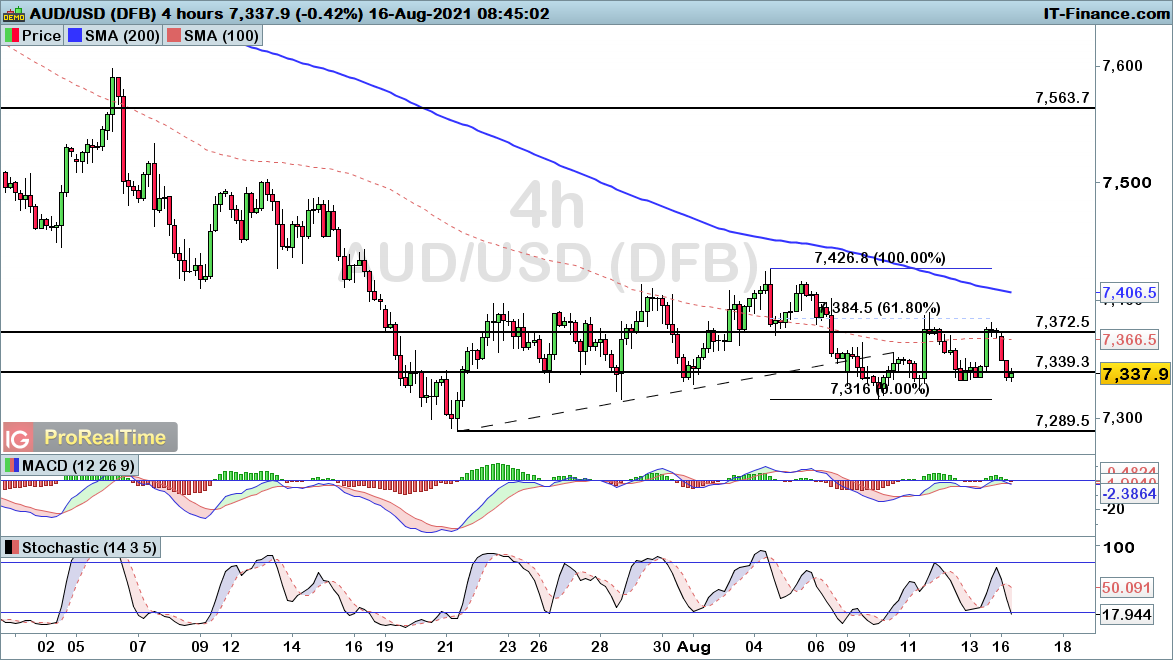
AUD/USD continues to remain at risk as the price consolidates
AUD/USD has been consolidating for much of the past month, with the recent trendline break simply leading us into another period of sideways the price action.
The subsequent respect of 61.8% Fibonacci resistance around $0.7384 does highlight the potential for another breakdown from here, with a move through $0.7316 bringing greater confidence that we are set for another breakdown for this pair.
IGA, may distribute information/research produced by its respective foreign affiliates within the IG Group of companies pursuant to an arrangement under Regulation 32C of the Financial Advisers Regulations. Where the research is distributed in Singapore to a person who is not an Accredited Investor, Expert Investor or an Institutional Investor, IGA accepts legal responsibility for the contents of the report to such persons only to the extent required by law. Singapore recipients should contact IGA at 6390 5118 for matters arising from, or in connection with the information distributed.
The information/research herein is prepared by IG Asia Pte Ltd (IGA) and its foreign affiliated companies (collectively known as the IG Group) and is intended for general circulation only. It does not take into account the specific investment objectives, financial situation, or particular needs of any particular person. You should take into account your specific investment objectives, financial situation, and particular needs before making a commitment to trade, including seeking advice from an independent financial adviser regarding the suitability of the investment, under a separate engagement, as you deem fit.
No representation or warranty is given as to the accuracy or completeness of this information. Consequently, any person acting on it does so entirely at their own risk. Please see important Research Disclaimer.
Please also note that the information does not contain a record of our trading prices, or an offer of, or solicitation for, a transaction in any financial instrument. Any views and opinions expressed may be changed without an update.

Start trading forex today
Trade the largest and most volatile financial market in the world.
- Spreads start at just 0.6 points on EUR/USD
- Analyse market movements with our essential selection of charts
- Speculate from a range of platforms, including on mobile
Live prices on most popular markets
- Forex
- Shares
- Indices
See more forex live prices
See more shares live prices
Prices above are subject to our website terms and agreements. Prices are indicative only. All shares prices are delayed by at least 15 mins.
See more indices live prices
Prices above are subject to our website terms and agreements. Prices are indicative only. All shares prices are delayed by at least 20 mins.
