FTSE, DAX and Dow showing signs of topping out
The FTSE, DAX, and Dow show signs of potentially topping out, with all eyes turning to the US jobs report to wrap up a busy week.
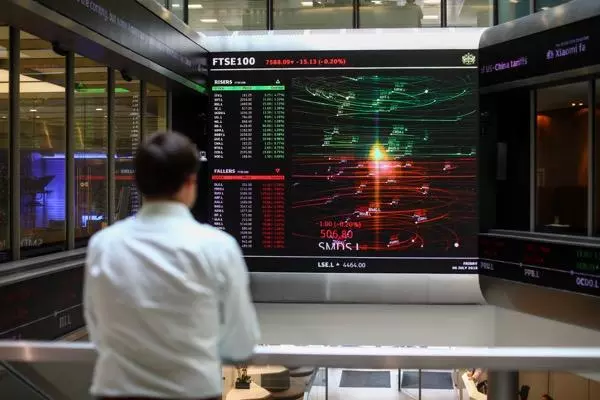
FTSE 100 rises to six-week high
The FTSE 100 has been a notable outperformer in a week that has seen equity markets find themselves under pressure.
A potential stochastic breakdown through the 80 threshold failed to materialise given yesterday’s pop. Thus, the sell signal holds off for now.
This index does stand out as a major outlier thanks to the influence of FX markets, with internationally-focused stocks benefitting from sharp declines in GBP/USD, and a rising EUR/GBP.
Coming off the back of a historic rate hike from the Bank of England (BoE) and warnings of the longest recession in history, the pathway for the pound will be key for the FTSE 100.
While the index could rise further, this current rebound looks to be setting up a bearish reversal. Keep an eye out for a potential turn lower from the 61.8% to 76.4% Fibonacci zone (7244-7371).

DAX showing signs of having topped out
The DAX is attempting to regain lost ground today, coming off the back of a period that has seen a bearish engulfing pattern signal the potential for a market top.
Coming at the 76.4% Fibonacci resistance level (13465), there is a good chance this current rise is short-term in nature as momentum starts to reverse. Notably, the stochastic oscillator has broken through the 80 threshold, bringing a sell signal that has been historically very timely in nature.
From a data perspective, further warning signs of a German contraction have been provided by a six-month low in factory orders, which fell 4% in the month of September alone.
As such, another bearish turn looks likely before long, with a move up through the 13570 required to raise questions over the validity of this view.

Dow reverses from Fibonacci resistance
The Dow has been heading sharply higher over the course of October, but that appears to have come to a swift end in November, with the index turning sharply lower this week.
With the stochastic falling below the 80 threshold as price reverses lower from the 76.4% Fibonacci resistance level, there is a strong chance that we have topped out here.
Keep a close eye out for the jobs report this afternoon for any signs that the economy is on the turn. A bearish view holds unless price rises through the 34286 swing-high.

IGA, may distribute information/research produced by its respective foreign affiliates within the IG Group of companies pursuant to an arrangement under Regulation 32C of the Financial Advisers Regulations. Where the research is distributed in Singapore to a person who is not an Accredited Investor, Expert Investor or an Institutional Investor, IGA accepts legal responsibility for the contents of the report to such persons only to the extent required by law. Singapore recipients should contact IGA at 6390 5118 for matters arising from, or in connection with the information distributed.
The information/research herein is prepared by IG Asia Pte Ltd (IGA) and its foreign affiliated companies (collectively known as the IG Group) and is intended for general circulation only. It does not take into account the specific investment objectives, financial situation, or particular needs of any particular person. You should take into account your specific investment objectives, financial situation, and particular needs before making a commitment to trade, including seeking advice from an independent financial adviser regarding the suitability of the investment, under a separate engagement, as you deem fit.
No representation or warranty is given as to the accuracy or completeness of this information. Consequently, any person acting on it does so entirely at their own risk. Please see important Research Disclaimer.
Please also note that the information does not contain a record of our trading prices, or an offer of, or solicitation for, a transaction in any financial instrument. Any views and opinions expressed may be changed without an update.

Take a position on indices
Deal on the world’s major stock indices today.
- Trade the lowest Wall Street spreads on the market
- 1-point spread on the FTSE 100 and Germany 40
- The only provider to offer 24-hour pricing
Live prices on most popular markets
- Forex
- Shares
- Indices
See more forex live prices
See more shares live prices
Prices above are subject to our website terms and agreements. Prices are indicative only. All shares prices are delayed by at least 15 mins.
See more indices live prices
Prices above are subject to our website terms and agreements. Prices are indicative only. All shares prices are delayed by at least 20 mins.
