Meta Platforms Q3 2024 earnings: digital ad market growth and AI investments
Discover Meta Platforms' Q3 2024 earnings projections, focusing on revenue growth, AI investments, and strategies to stay ahead in the digital ad market. Explore key financial metrics and market expectations.


When does Meta Platforms report earnings?
Meta Platforms (formerly Facebook) is set to release its Q3 2024 financial results on 31 October, 2024 at 7.10am AEDT after the US market closes.
Meta Platforms’ 3Q 2024 results – what to expect
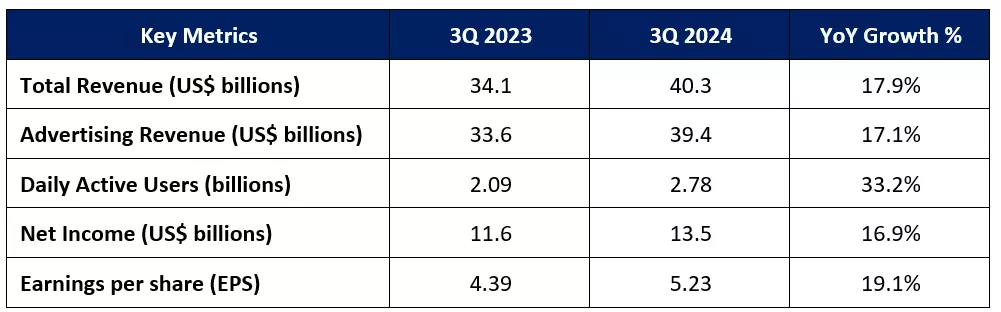
Expectations are for Meta’s Q3 revenue to register a 17.9% year-on-year (YoY) growth to US$40.3 billion, up from US$34.1 billion a year ago. This will mark the second straight quarter of revenue growth slowdown (Q1 2024: 27.3%, Q2 2024: 22.1%).
Earnings per share (EPS) is expected to grow 19.1% YoY to US$5.23, compared to US$4.39 a year ago.
Meta poised for further share gains in the digital ad market
In Q2 2024, Meta’s advertising sales increased 22%, double the growth rate of its top rival Google. It is likely to maintain its edge over Google in Q3 2024 as well, with ad revenue expected to grow 17.1% versus Google’s estimated 9.7%.
Meta’s significant investment in artificial intelligence (AI) may be contributing to its market share gains in the digital advertising industry. Any stronger-than-expected revenue growth may further validate its dominance.
Improvement in ad pricing will also be a positive sign for investors, following its recovery cycle since 2023. This may indicate whether Meta is effectively competing against platforms like TikTok.
More clarity to be sought on investment spending
Thus far, Meta's investment in AI models, particularly Llama 3 and the upcoming Llama 4, has been extensive, with capital expenditure projected to be between US$37 billion and US$40 billion in 2024. While Llama 4 is set for release only in 2025, any signs of how these AI technologies may contribute to revenue will be crucial.
Meta’s Reality Labs division (which handles virtual reality and metaverse initiatives) has also been a significant drag on profits. In Q2 2024, operating losses for this segment were US$4.5 billion, a 20% increase from a year ago. Investors will be on the lookout for spending levels and how soon these investments may yield results.
Meta expects “significant capital expenditures growth” in 2025 on AI research and product development efforts.
Key performance metrics under scrutiny (DAP, ad impressions, average price per ad)
In Q2 2024, Meta’s Family daily active people (DAP) rose 7% YoY, while ad impressions and average price per ad both increased by 10% from a year ago. These healthy growth levels reflect robust demand for Meta’s advertising services and improved ad performance, validating Meta’s better ad targeting capabilities.
Expectations are for this growth momentum to continue in Q3 2024 to reinforce Meta’s strong position in the digital ad market. Catalysts may include the US election period, which may bring significant political ad spending, while a resilient US economic outlook is expected to drive business confidence and more corporate ad spending.
Technical analysis – bullish bias remains intact on broader upward trend
Trend indicators point to a bullish bias for Meta, with its share price supported by its daily Ichimoku Cloud, 200-day moving average (MA), and an upward trendline of higher lows since November 2022. Its weekly relative strength index (RSI) also shows that Meta’s share price has been trading above its mid-line since January 2023, indicating that buyers remain in control. This leaves buying on dips as the preferred approach, with the US$539.16 level offering near-term support to watch, followed by the US$480.20 level.
On the upside, the key psychological US$600.00 level has served as resistance lately. Any break above the US$600.00 level may lead to the US$684.56 level next based on a Fibonacci extension level (from September 2021 to October 2022).
Meta daily chart

IGA, may distribute information/research produced by its respective foreign affiliates within the IG Group of companies pursuant to an arrangement under Regulation 32C of the Financial Advisers Regulations. Where the research is distributed in Singapore to a person who is not an Accredited Investor, Expert Investor or an Institutional Investor, IGA accepts legal responsibility for the contents of the report to such persons only to the extent required by law. Singapore recipients should contact IGA at 6390 5118 for matters arising from, or in connection with the information distributed.
The information/research herein is prepared by IG Asia Pte Ltd (IGA) and its foreign affiliated companies (collectively known as the IG Group) and is intended for general circulation only. It does not take into account the specific investment objectives, financial situation, or particular needs of any particular person. You should take into account your specific investment objectives, financial situation, and particular needs before making a commitment to trade, including seeking advice from an independent financial adviser regarding the suitability of the investment, under a separate engagement, as you deem fit.
No representation or warranty is given as to the accuracy or completeness of this information. Consequently, any person acting on it does so entirely at their own risk. Please see important Research Disclaimer.
Please also note that the information does not contain a record of our trading prices, or an offer of, or solicitation for, a transaction in any financial instrument. Any views and opinions expressed may be changed without an update.

Seize a share opportunity today
Go long or short on thousands of international stocks.
- Increase your market exposure with leverage
- Get spreads from just 0.1% on major global shares
- Trade CFDs straight into order books with direct market access
Live prices on most popular markets
- Forex
- Shares
- Indices
See more forex live prices
See more shares live prices
Prices above are subject to our website terms and agreements. Prices are indicative only. All shares prices are delayed by at least 15 mins.
See more indices live prices
Prices above are subject to our website terms and agreements. Prices are indicative only. All shares prices are delayed by at least 20 mins.
