Tesla’s share price: what to expect from Q2 results
Find out what to expect from Tesla’s earnings results, how they will affect Tesla share price, and how to trade Tesla’s earnings.


When is Tesla’s results date?
Tesla announced that it will release its latest figures for quarter two (Q2) of 2021 on Monday, 26 July after market closes.
Tesla share price: forecasts from Q2 results
Based on Q2 deliveries, whose figures were released earlier this month, it was a record that was roughly within Wall Street estimates on a total of 201,250 vehicles delivered and production at 206,421. From a profit point of view, the issue is that 99% of those deliveries were made up of Model 3 and Y, less than 1% being the high-margin Model S and X models. And while newer versions of the latter two are expected to positively factor into future earnings, for the time being, traders and investors will have to settle with low-margin models to formulate the Q2 earnings story.
There have been price increases over the past quarter in an attempt to offset supply chain pressures that included raw materials price increases and chip shortages. And while higher prices and deliveries should translate into higher revenue, overcoming tested profit margins will also be noted. Difficulties in China not just on the regulatory front but also from domestic competition, deliveries rebounding in May and June from April’s slump.
There’s also exposure to crypto volatility, which last time around might have been a positive on bitcoin prices surging, but could be in for a bit more pain this time around given prices are considerably lower (roughly half its record $64,900 highs). Reliance on regulatory credits to take earnings into the green will wane as competitors aggressively tackle the electric vehicle (EV) market.
But aside from the updates on its latest products, model updates, and production plans, in the end it’s about the numbers, and expectations are for an earnings per share (EPS) of $0.96, and where revenue will nearly double last year’s $6.04 billion at $11.21 billion given the delivery and price increases. Targets continue to vary significantly when it comes to Tesla share prices, the average though close to where its current market price is hovering near. Recommendations are also across the board, but average out to a hold with slight upside bias (source: finance.yahoo.com).
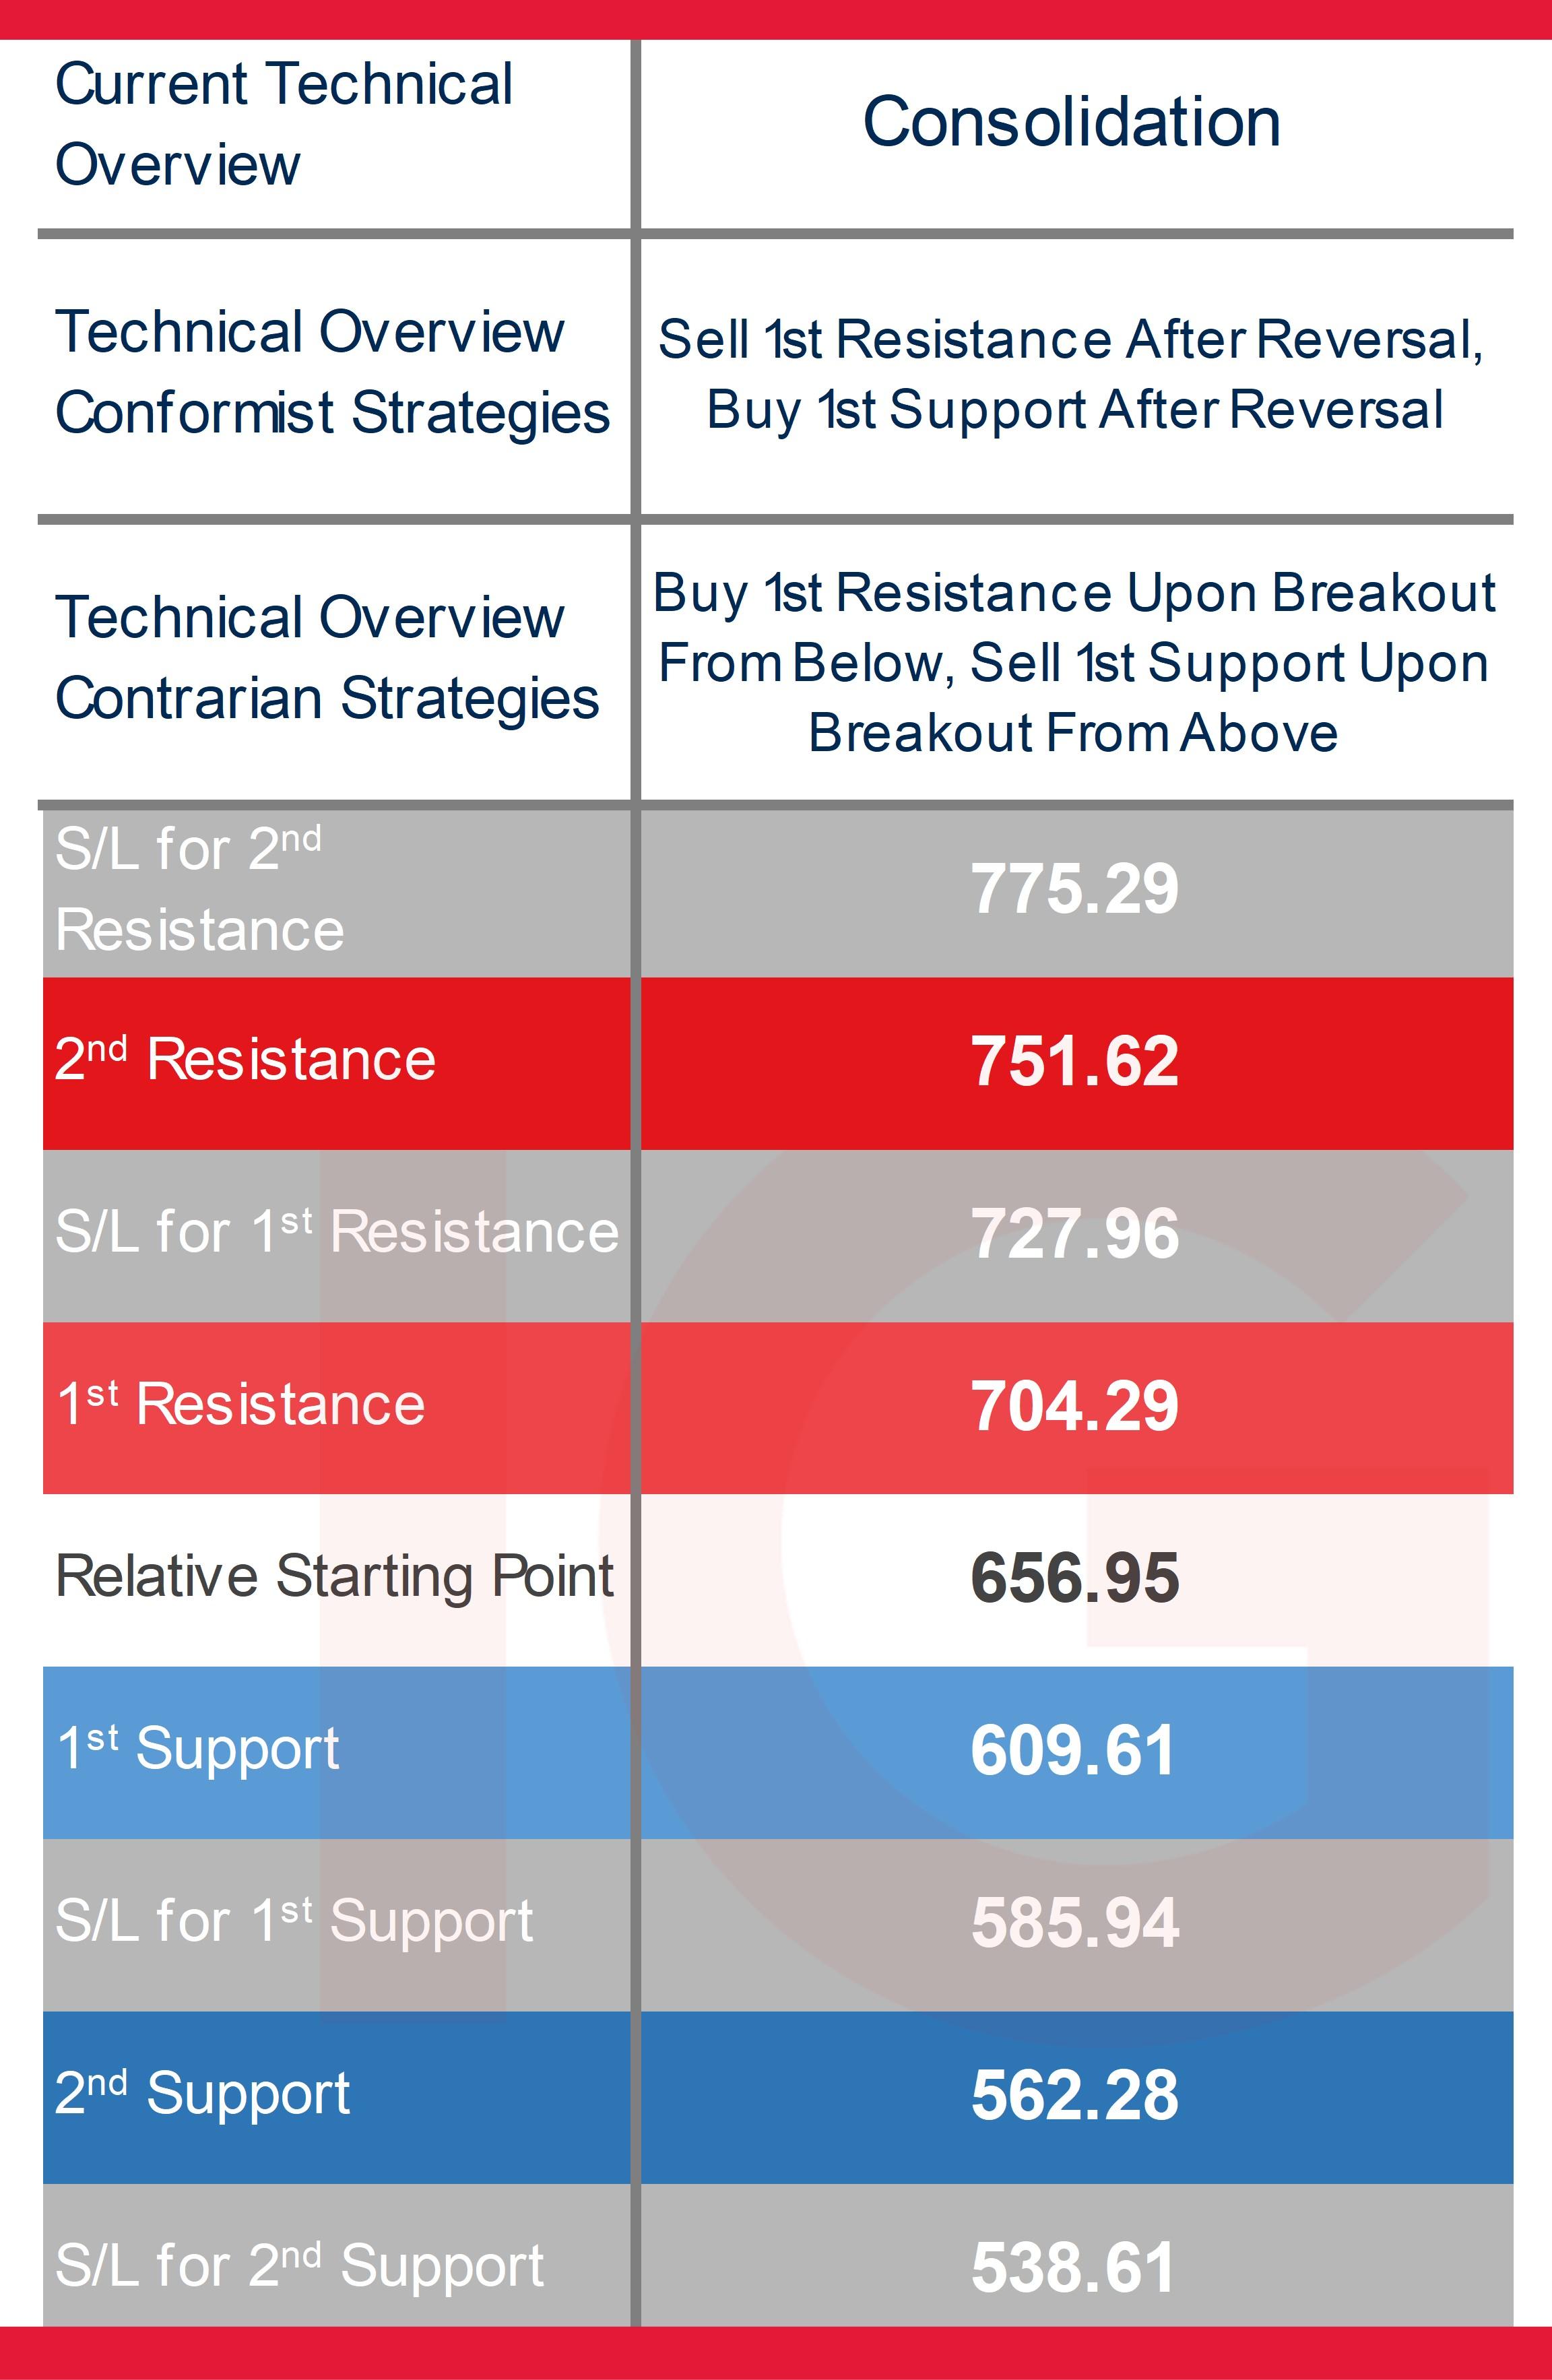
Trading Tesla’s Q2 results: technical overview and trading strategies
Technicals are of far less relevance when it comes to fundamental events that can take prices past key levels with ease, and the technical overview thus far has been consolidatory as prices oscillate staying above its main weekly long-term moving averages but where other key technical indicators are primarily neutral, an average directional movement index (ADX) no longer showing a propensity to trend in that time frame.
On a normal day, those looking to trade conforming to the technical overview might consider reversals (initiating a buy strategy after the fist support is broken only if prices manage to recover to that level, or initiating a sell position after the first resistance level is breached first and only if prices come back down to that level), given fading a volatile move will result in getting stopped out with ease. Those expecting a breakout and for the current technical overview to fail can consider breakout strategies when prices reach those levels to capitalise on a potential move to a new zone.
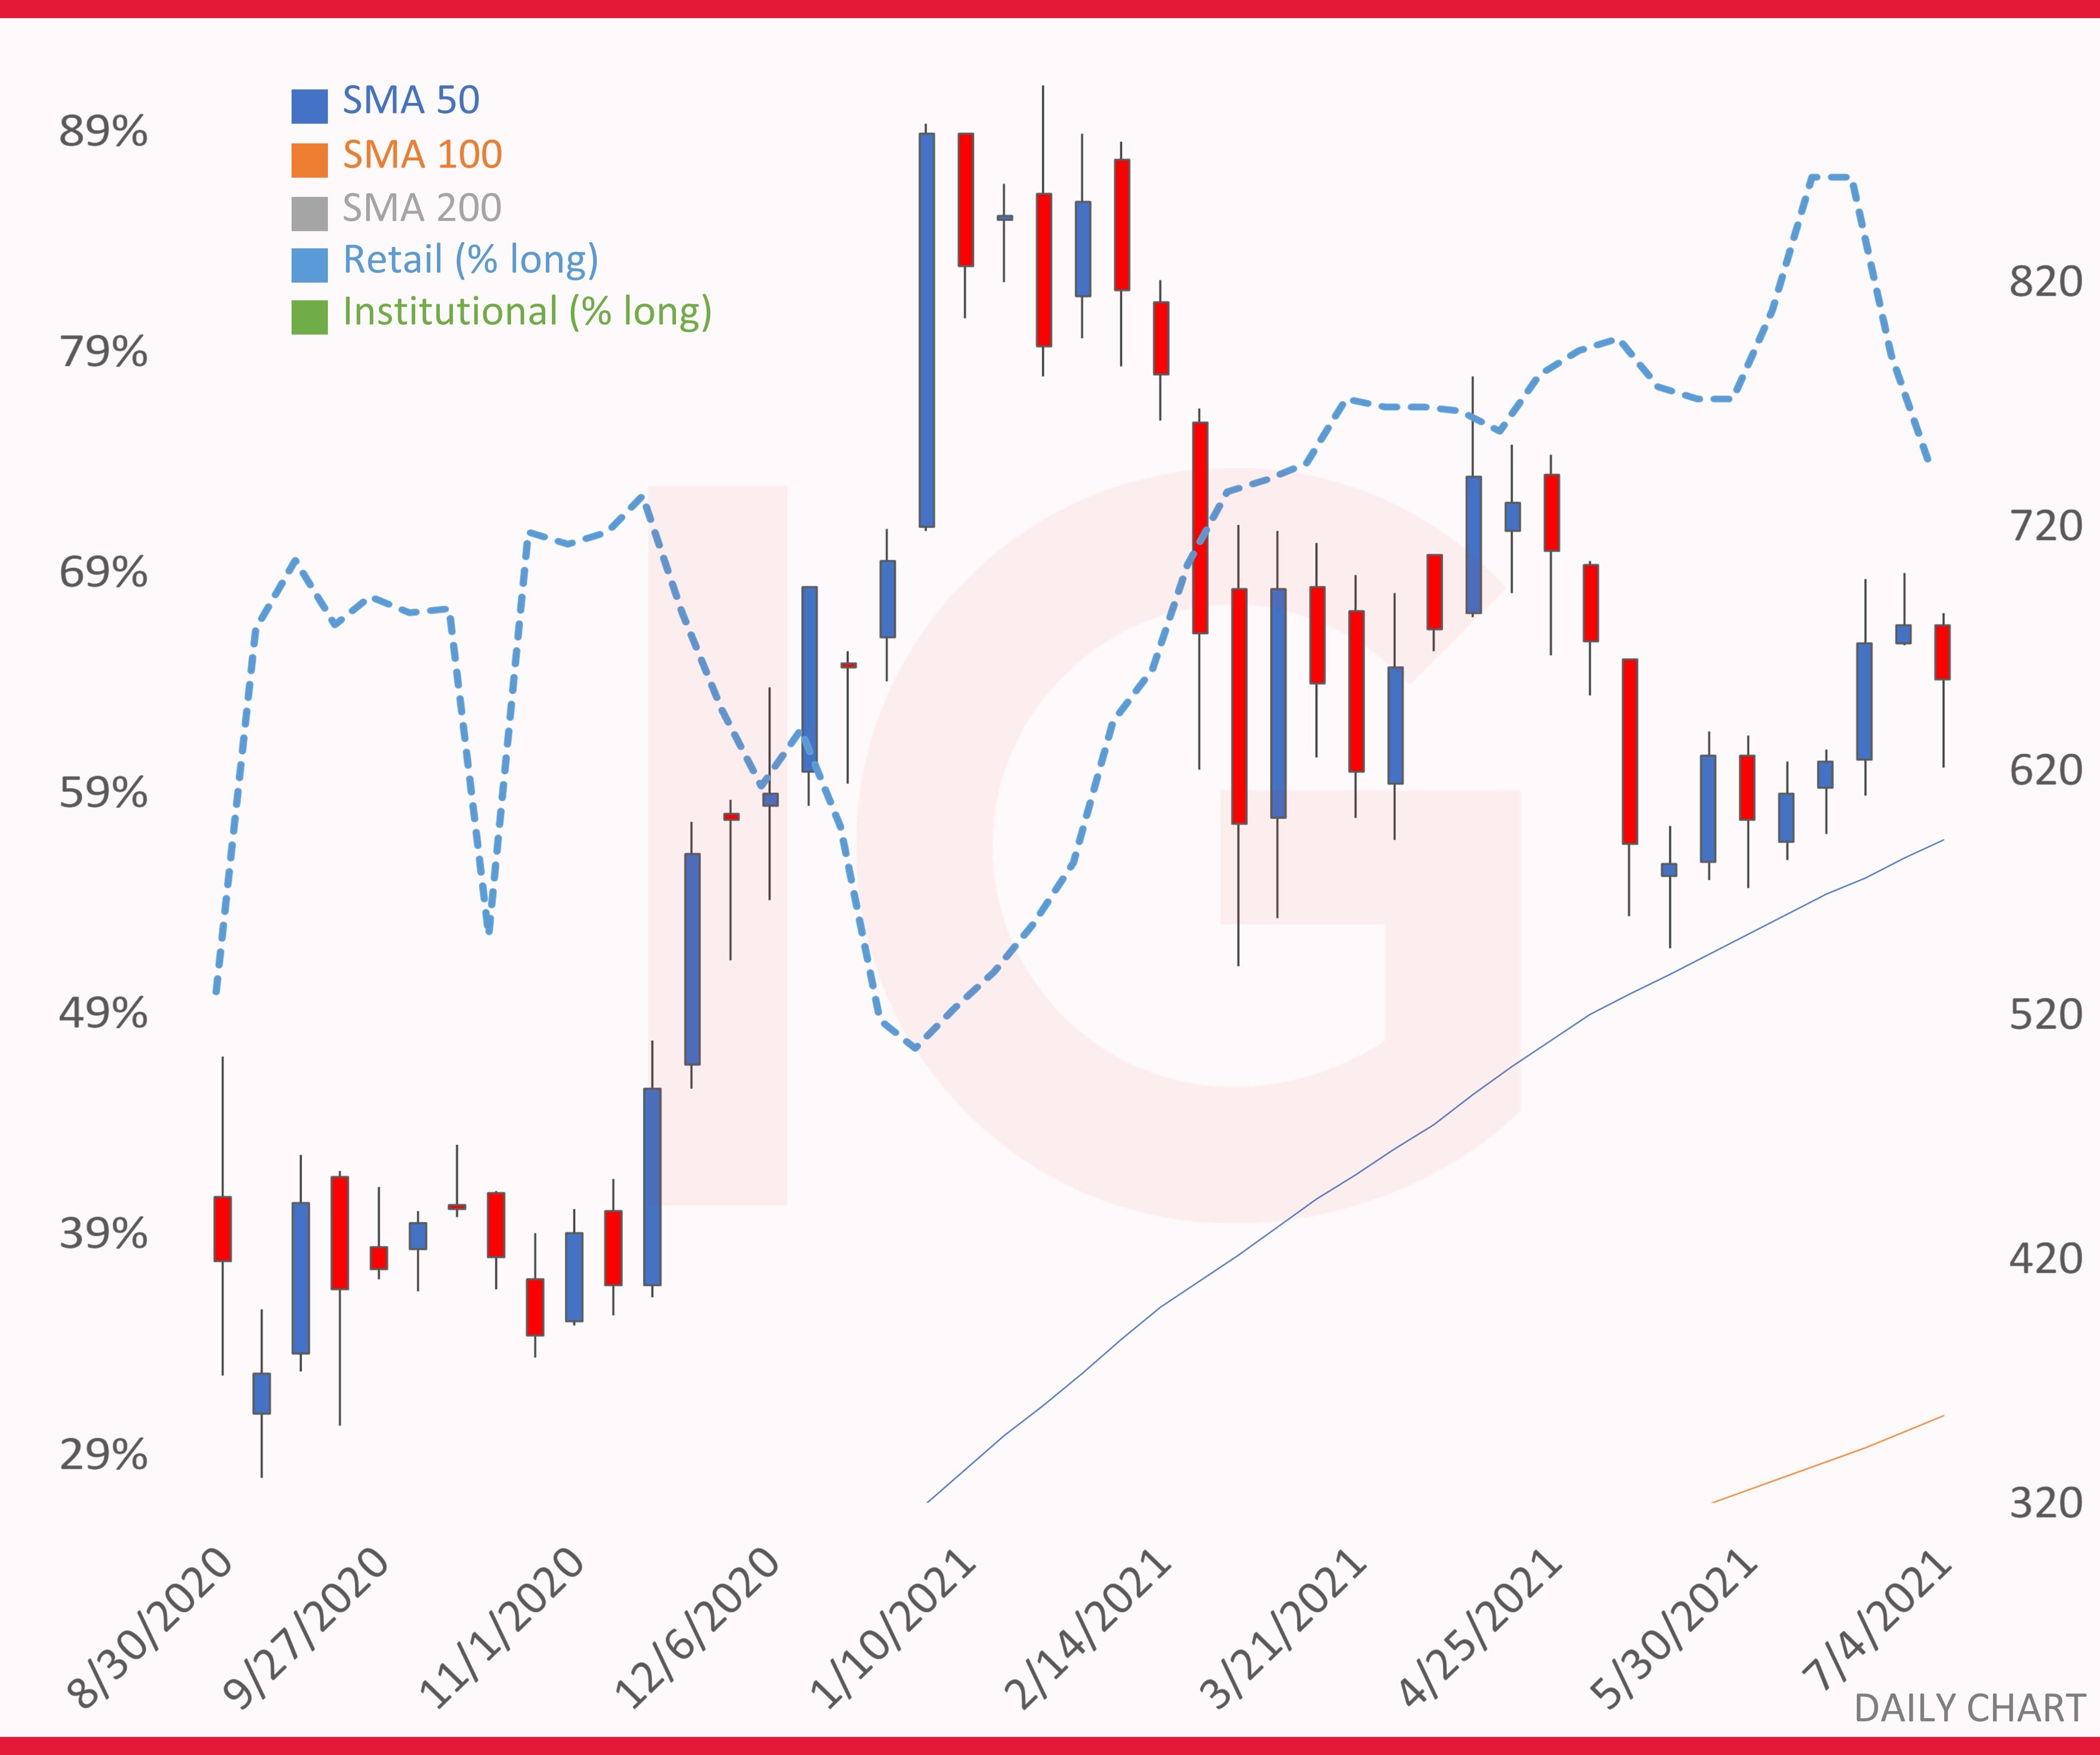
Tesla daily chart with retail sentiment
IG client sentiment* and short interest for Tesla shares
When it comes to client sentiment, it’s been a consistent heavy buy bias, the latest at 74% and below extreme buy 87% bias back in June as longs got enticed into closing out on the lift off of its previous short-term support level at around $540.
As for short interest, it’s considerably less than what it was at around the same time last year, when the figure was above 60 million. As of 30 June it was nearly half that amount, at 34,093,281, and is 4.4% of the shares floated, and dropping from 39,363,717 two weeks before that (source: shortsqueeze.com).
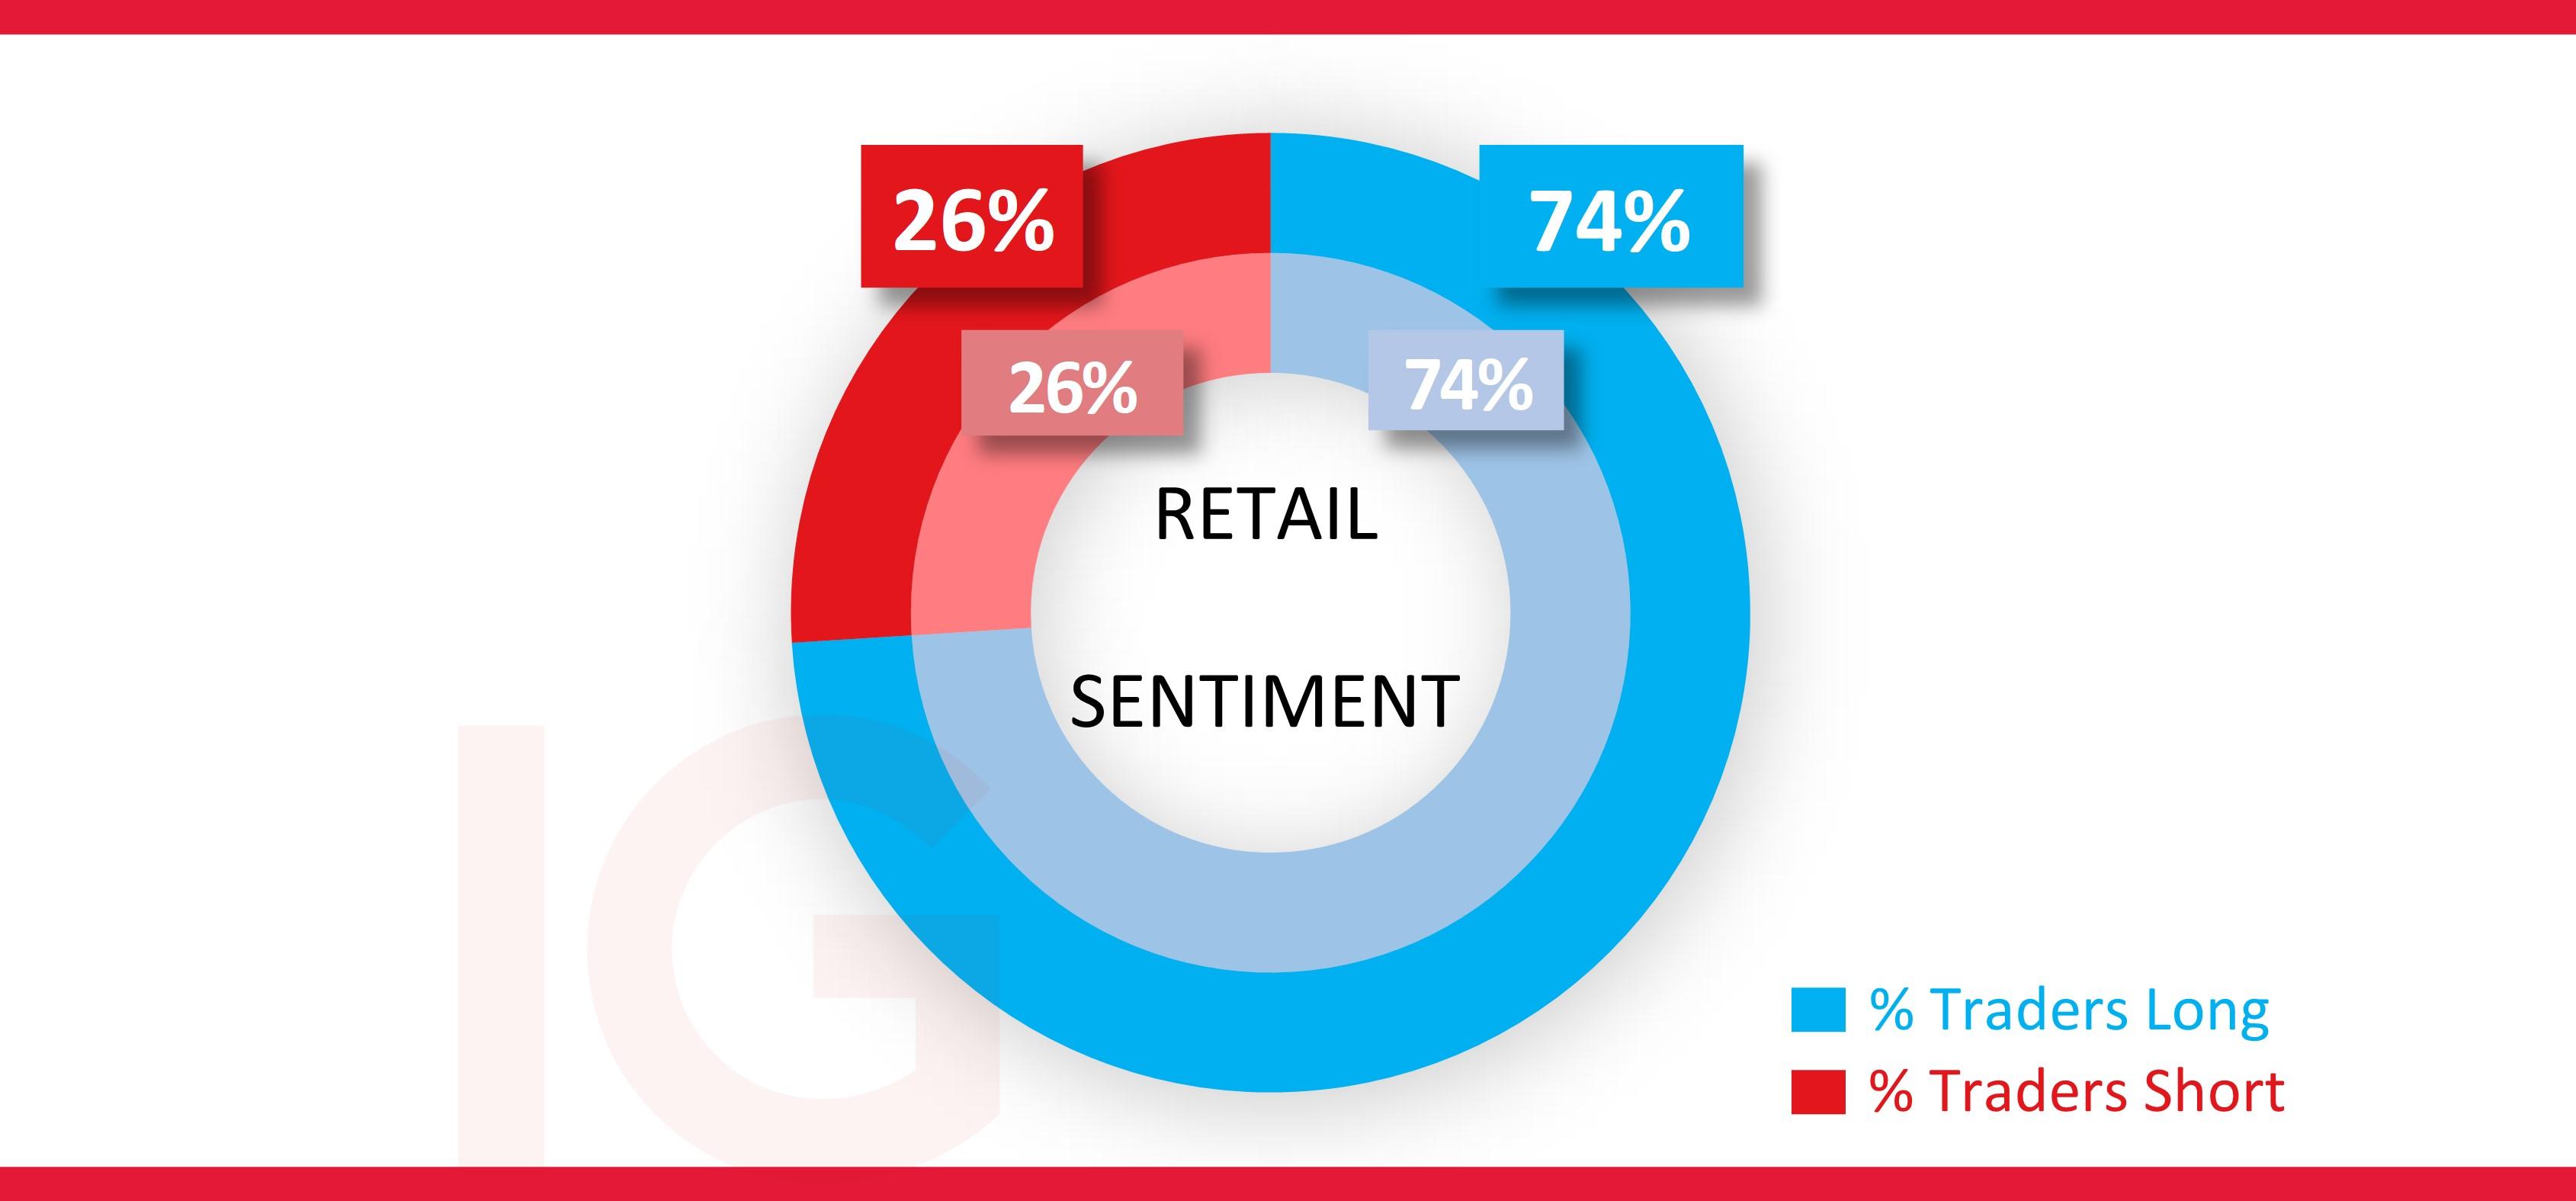
*The percentage of IG client accounts with positions in this market that are currently long or short. Calculated to the nearest 1%, as of today morning 8am for the outer circle. Inner circle is from the previous trading day.
IGA, may distribute information/research produced by its respective foreign affiliates within the IG Group of companies pursuant to an arrangement under Regulation 32C of the Financial Advisers Regulations. Where the research is distributed in Singapore to a person who is not an Accredited Investor, Expert Investor or an Institutional Investor, IGA accepts legal responsibility for the contents of the report to such persons only to the extent required by law. Singapore recipients should contact IGA at 6390 5118 for matters arising from, or in connection with the information distributed.
The information/research herein is prepared by IG Asia Pte Ltd (IGA) and its foreign affiliated companies (collectively known as the IG Group) and is intended for general circulation only. It does not take into account the specific investment objectives, financial situation, or particular needs of any particular person. You should take into account your specific investment objectives, financial situation, and particular needs before making a commitment to trade, including seeking advice from an independent financial adviser regarding the suitability of the investment, under a separate engagement, as you deem fit.
No representation or warranty is given as to the accuracy or completeness of this information. Consequently, any person acting on it does so entirely at their own risk. Please see important Research Disclaimer.
Please also note that the information does not contain a record of our trading prices, or an offer of, or solicitation for, a transaction in any financial instrument. Any views and opinions expressed may be changed without an update.

Seize a share opportunity today
Go long or short on thousands of international stocks.
- Increase your market exposure with leverage
- Get spreads from just 0.1% on major global shares
- Trade CFDs straight into order books with direct market access
Live prices on most popular markets
- Forex
- Shares
- Indices
See more forex live prices
See more shares live prices
Prices above are subject to our website terms and agreements. Prices are indicative only. All shares prices are delayed by at least 15 mins.
See more indices live prices
Prices above are subject to our website terms and agreements. Prices are indicative only. All shares prices are delayed by at least 20 mins.
