Wall Street Wrap: US labour conditions eased, Nasdaq back to retest trendline support
Wall Street ended last week in the red, with some unwinding in tech stocks on Friday while the VIX touched its highest level in two weeks.


Market Recap
Wall Street ended last week in the red, with some unwinding in tech stocks on Friday while the VIX touched its highest level in two weeks. The highlight was the US February job report, which saw cooling US labour conditions as the main takeaway. The US unemployment rate rose to its highest since January 2022 at 3.9% (versus 3.7% consensus), while wages grew at the slowest rate in two years at 0.1% month-on-month. Job additions did come in above expectations (275,000 versus 200,000 consensus), but the strength was stifled by downward revisions in previous readings.
The figures could be what the Federal Reserve (Fed) hopes to see, with a softer labour market supporting an earlier timeline for rate cuts, but market participants seem to take the opportunity for some profit-taking instead. Treasury yields were broadly lower, paving the way for the US dollar to weaken further. Gold prices took comfort in that, extending its gains for the eighth straight trading day to hang around the US$2,186 level.
Look-ahead: US CPI
Ahead, the new week may kick off on a more cautious tone as markets look towards the US consumer price index (CPI) release on Tuesday. Given the hotter-than-expected inflation data in January, traders will be closely watching this month’s CPI to be convinced that previous data is just a one-off. Expectations are for headline inflation to remain steady at 3.1%, while the core aspect may ease to 3.7% from previous 3.9%. If it holds true, this will be the lowest year-on-year core reading since April 2021, which may further bolster earlier rate cut bets.
What to watch: Nasdaq 100
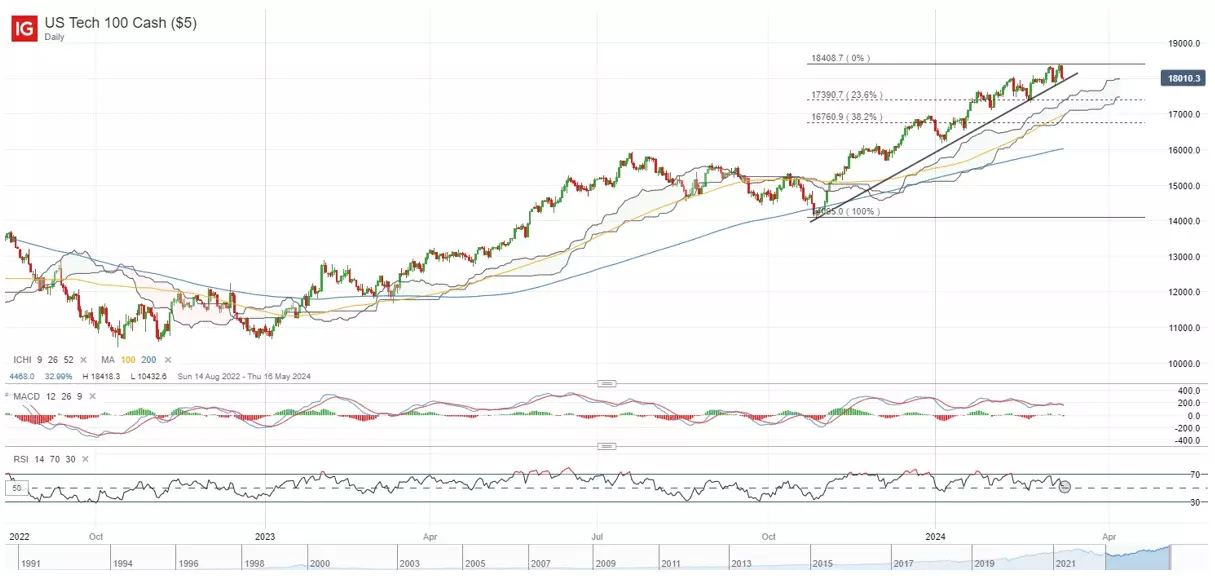
The Nasdaq 100 index is back to flirt with its 18,000 level, leaving a near-term upward trendline on watch for some immediate defending from buyers. Failure for the trendline support to hold may pave the way for the index to retrace further to the 17,390 level, where a 23.6% Fibonacci retracement level stands. For now, its daily relative strength index (RSI) has also edged back to the mid-point level of 50, which buyers have successfully defended since November 2023. Any dip below the mid-point this week could bring about a near-term downward bias, suggesting further cooling in the recent risk rally.
IGA, may distribute information/research produced by its respective foreign affiliates within the IG Group of companies pursuant to an arrangement under Regulation 32C of the Financial Advisers Regulations. Where the research is distributed in Singapore to a person who is not an Accredited Investor, Expert Investor or an Institutional Investor, IGA accepts legal responsibility for the contents of the report to such persons only to the extent required by law. Singapore recipients should contact IGA at 6390 5118 for matters arising from, or in connection with the information distributed.
The information/research herein is prepared by IG Asia Pte Ltd (IGA) and its foreign affiliated companies (collectively known as the IG Group) and is intended for general circulation only. It does not take into account the specific investment objectives, financial situation, or particular needs of any particular person. You should take into account your specific investment objectives, financial situation, and particular needs before making a commitment to trade, including seeking advice from an independent financial adviser regarding the suitability of the investment, under a separate engagement, as you deem fit.
No representation or warranty is given as to the accuracy or completeness of this information. Consequently, any person acting on it does so entirely at their own risk. Please see important Research Disclaimer.
Please also note that the information does not contain a record of our trading prices, or an offer of, or solicitation for, a transaction in any financial instrument. Any views and opinions expressed may be changed without an update.

Seize a share opportunity today
Go long or short on thousands of international stocks.
- Increase your market exposure with leverage
- Get spreads from just 0.1% on major global shares
- Trade CFDs straight into order books with direct market access
Live prices on most popular markets
- Forex
- Shares
- Indices
See more forex live prices
See more shares live prices
Prices above are subject to our website terms and agreements. Prices are indicative only. All shares prices are delayed by at least 15 mins.
See more indices live prices
Prices above are subject to our website terms and agreements. Prices are indicative only. All shares prices are delayed by at least 20 mins.
