WTI Crude (SGD1 Contract)
GRA- Costs and details
- Related markets
Why IG?
Gold spreads from just 0.3 points
Continuous, backdated commodity charting
Wide range of energies, metals and softs
Discover opportunity in-platform
Open a free, no-risk demo account to stay on top of commodity movement and important events.

Real-time charts
Analyse commodity price action on charts with live and historical data, available for as long as you need
Trading signals
Identify the right time to trade on commodities and more, with free technical signals
Three types of alert
Be notified when a commodity changes an amount, hits a level or fulfills your technical conditions
Spot markets
Trade gold, silver and more with continuous charting and no monthly expiries
WTI Crude (SGD1 Contract) news and strategies from IG
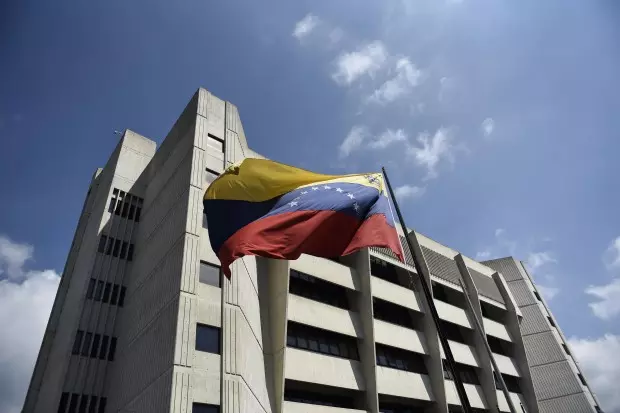
How does US intervention in Venezuela impact global markets?
You might be interested in…
Gold spreads from 0.3 points, continuous charting and greater profit and loss transparency. Find out more about why you should trade commodities with IG.
Discover why so many clients choose us, and what makes us the world's No.1 provider of CFDs.1
Improve your trading skills by working through interactive courses on the IG Academy app.
1 Based on revenue (excluding FX), published financial statements, February 2024.
Connect with us
Disclaimers:
- All forms of investments carry risks, including the potential loss of all or part of your principal amount invested. The value of an investment product may rise or fall, and may also become valueless. Past performance is not indicative of future results. Please ensure that you fully understand, and are aware of, the risks and costs involved.
- Trading CFDs may not be suitable for everyone. CFDs are leveraged instruments and can result in losses that exceed deposits. Refer to the Risk Disclosure Statement and Risk Fact sheet.
- IG Asia Pte Ltd (Co. Reg. No. 200510021K)("IG") is regulated by the Monetary Authority of Singapore and holds a capital markets services licence.
- IG provides an execution-only service. The information in this advertisement does not contain (and should not be construed as containing) investment advice or an investment recommendation, or an offer of or solicitation for a transaction in any financial instrument. IG accepts no responsibility for any use that may be made of these comments and for any consequences that result. You should consider your specific investment objectives, financial situation or particular needs before making a commitment to trade, including seeking advice from an independent financial adviser regarding the suitability of the investment, under a separate engagement, as you deem fit.
- The information on this site is not directed at residents of the United States or Belgium and is not intended for distribution to, or use by, any person in any country or jurisdiction where such distribution or use would be contrary to local law or regulation.
- This advertisement has not been reviewed by the Monetary Authority of Singapore.
