Apple Stock Stumbles on AI and iPhone Concerns
Apple’s recent stock weakness marks a divergence with other members of the Magnificent 7 and the broader Nasdaq 100.

The decline comes as doubts loom about Apple's artificial intelligence (AI) initiatives. Rivals like Microsoft are delivering strong earnings growth tied to burgeoning AI technology. This was highlighted by Tuesday's report that Apple is discontinuing its decade-long electric vehicle project. Back in 2017, Apple CEO Tim Cook called the autonomous car endeavour the "mother of all AI projects."
Stock Underperforms Broader Market
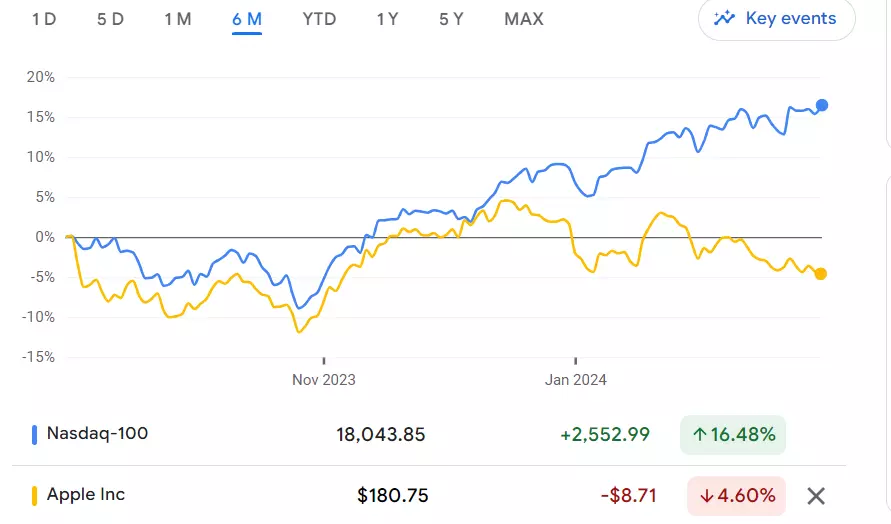
So far in 2024, Apple shares have dropped 3%, trailing the S&P 500's 7% gain and the Nasdaq's 9% climb. Despite its long-term market-beating returns, Apple has recently lagged the S&P 500 on 6-month, 1-year, and 2-year timeframes, according to FactSet data.
After spending most of 2021 to 2023 as the world's most valuable public company by market capitalization, Apple surrendered that crown to Microsoft in January. Microsoft's sales and profit growth have far outpaced Apple's, which posted negative growth in its 2022 fiscal year ending last September.
AI Investment Hints but Details Lacking
At Wednesday's shareholder meeting, Cook suggested Apple is "investing significantly" in generative AI. He said more specifics will be announced later this year. UBS analyst David Vogt predicts Apple's first major AI launch will come in June at its annual Worldwide Developers Conference.
iPhone Sales Weakness Looms
In addition to AI uncertainties, expectations for weak iPhone sales growth continue to weigh on Apple. iPhones accounted for 58% of Apple's total revenue last quarter.
Some See Positives in Car Project Halt
Some analysts see a silver lining in the halt of Apple's electric car plans. It enables the company to refocus AI talent on nearer-term products with greater market potential. To Morgan Stanley, it also shows Apple's "cost discipline."
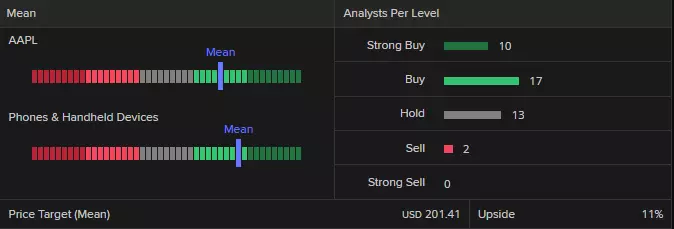
Apple analyst rating
LSEG (formerly known as Refinitiv) data shows a consensus analyst rating of ‘buy’ for Apple with 10 strong buy, 17 buy, 13 hold and 2 sell – and a mean of estimates suggesting a long-term price target of $201.41 for the share, roughly 16% higher than the current price (as of 1 March 2024).
Technical outlook on the Apple share price
The Apple share price continues to precariously weigh on its $180.30 to $179.25 support zone which consists of the January-to-February lows.
A fall through and daily chart close below this area looks increasingly likely and would lead to levels being reached which were last traded in early-November with the 3 November low at $176.65 representing the first downside target.
Apple Daily Candlestick Chart
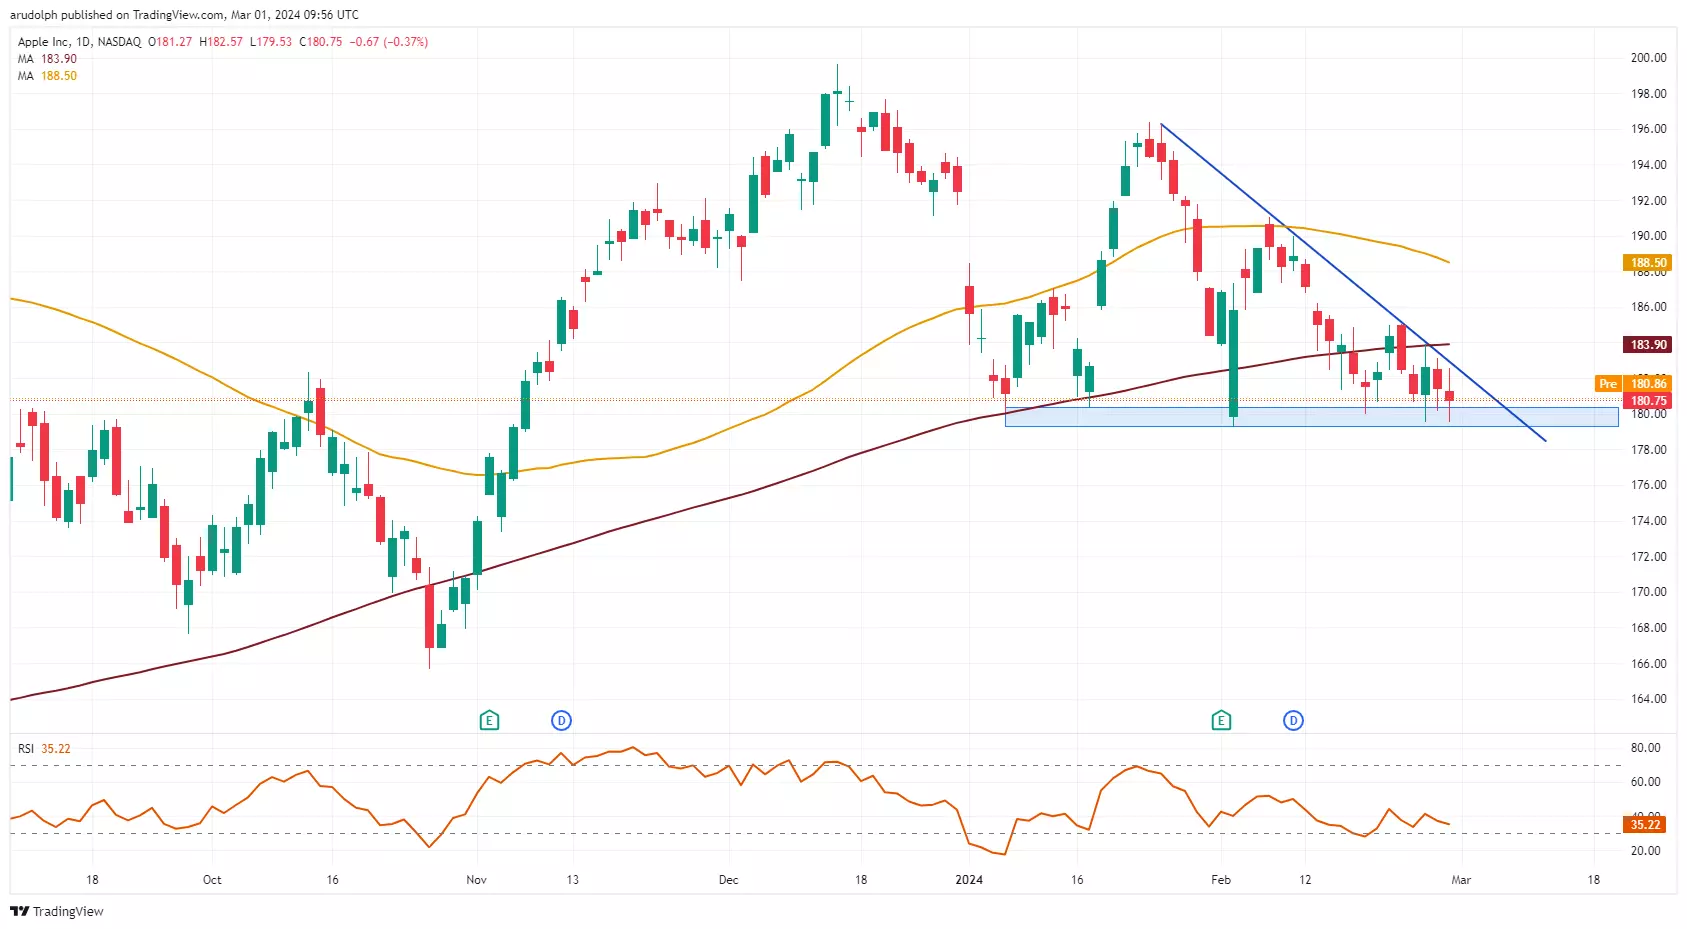
Further down sits the $174.49 August low below which key support can be spotted between the September and October lows at $167.62 to $165.67.
Were the $180.30 to $179.25 support zone to hold, though, a rise and daily chart close above last week’s high at $185.04 would need to occur, for a recovery off the support area to gain traction. In this scenario the Apple share price would trade back above its 200-day simple moving average (SMA) at $183.90 and target the 55-day SMA at $188.50.
This will continue to favour a fall through support at $179.25 to take place as long as the Apple share price continues to trade below last week’s high at $185.04.
IGA, may distribute information/research produced by its respective foreign affiliates within the IG Group of companies pursuant to an arrangement under Regulation 32C of the Financial Advisers Regulations. Where the research is distributed in Singapore to a person who is not an Accredited Investor, Expert Investor or an Institutional Investor, IGA accepts legal responsibility for the contents of the report to such persons only to the extent required by law. Singapore recipients should contact IGA at 6390 5118 for matters arising from, or in connection with the information distributed.
The information/research herein is prepared by IG Asia Pte Ltd (IGA) and its foreign affiliated companies (collectively known as the IG Group) and is intended for general circulation only. It does not take into account the specific investment objectives, financial situation, or particular needs of any particular person. You should take into account your specific investment objectives, financial situation, and particular needs before making a commitment to trade, including seeking advice from an independent financial adviser regarding the suitability of the investment, under a separate engagement, as you deem fit.
No representation or warranty is given as to the accuracy or completeness of this information. Consequently, any person acting on it does so entirely at their own risk. Please see important Research Disclaimer.
Please also note that the information does not contain a record of our trading prices, or an offer of, or solicitation for, a transaction in any financial instrument. Any views and opinions expressed may be changed without an update.

Seize a share opportunity today
Go long or short on thousands of international stocks.
- Increase your market exposure with leverage
- Get spreads from just 0.1% on major global shares
- Trade CFDs straight into order books with direct market access
Live prices on most popular markets
- Forex
- Shares
- Indices
See more forex live prices
See more shares live prices
Prices above are subject to our website terms and agreements. Prices are indicative only. All shares prices are delayed by at least 15 mins.
See more indices live prices
Prices above are subject to our website terms and agreements. Prices are indicative only. All shares prices are delayed by at least 20 mins.
