Super Micro Computers soars as it joins the S&P 500
Super Micro Computer (SMCI) stock closed up more than 18% on Monday after the company was selected to join the S&P 500.


SMCI joins the big boys
Super Micro Computer, a manufacturer of high-performance computing solutions, received a significant boost as its shares soared following the announcement of its inclusion in the S&P 500 index. The company's stock closed the trading day with a remarkable gain of over 18%, reflecting investor confidence and the recognition of Super Micro's position as a prominent player in the technology sector.
Super Micro shares are now up 278% this year after climbing 246% in 2023 and 87% in 2022, which was the worst year for tech stocks broadly since 2008.
The inclusion in the S&P 500 caps an extraordinary rally for Super Micro's stock. Despite 2022 being a challenging year for the tech industry, with it being the worst year for tech stocks broadly since the 2008 financial crisis, Super Micro defied the odds and delivered an impressive 87% gain. Building on this momentum, the company's shares have continued their upward trajectory, surging a staggering 246% in 2023 and a further 278% so far this year, making it one of the standout performers in the technology sector.
The company's market cap has soared from close to $4.5 billion at the end of 2022 to roughly $60 billion at Monday's close.
The remarkable performance of Super Micro's stock has translated into a substantial increase in the company's market capitalisation. From a relatively modest market cap of around $4.5 billion at the end of 2022, Super Micro has experienced a meteoric rise, with its market capitalisation skyrocketing to approximately $60 billion as of Monday's market close.
What is the criteria for inclusion in the S&P 500?
The S&P 500 is a stock market index that tracks the performance of 500 large-cap U.S. publicly traded companies. Here are the main criteria for a company to be included in the S&P 500 index:
- Market capitalisation: The company must have a market capitalisation that is large enough to be in compliance with the market cap ranges for the specific index (currently $14.5 billion)
- Public gloat: The company must have a public float of at least 10% of its shares outstanding.
- Financial viability: The company must have positive as-reported earnings over the most recent quarter and the most recent four quarters, combined.
- Adequate liquidity and reasonable Price: The ratio of annual dollar value traded to float-adjusted market capitalisation should be at least 1.0, and the stock should trade at a reasonable price.
- Sector representation: The company should be representative of a sector covered by the S&P 500.
- Domicile: The company must be based in the U.S. and traded on an eligible U.S. stock exchange.
- Trading period: The company should have an operating history of at least one year.
The inclusion criteria are designed to ensure that the S&P 500 represents the leading companies in the U.S. economy and provides a broad representation of the U.S. equity market. Companies are added or removed from the index periodically based on meeting these criteria.
SMCI stock price – technical analysis
The SMCI share price, which has already risen by over 275% year-to-date, once more gapped higher on Monday and hit a new record high at $1,155.
Unless this high is exceeded, in which case the $1,200 region would be eyed next, ahead of the minor psychological $1,500 mark, Monday’s $1,020.34 to $927 price gap is expected to at least partially get filled.
A similar price gap between the 21 and 22 February also got partially filled before the surge to Monday’s all-time high took place, something which is expected to happen once more this week as some investors cash in their profits.
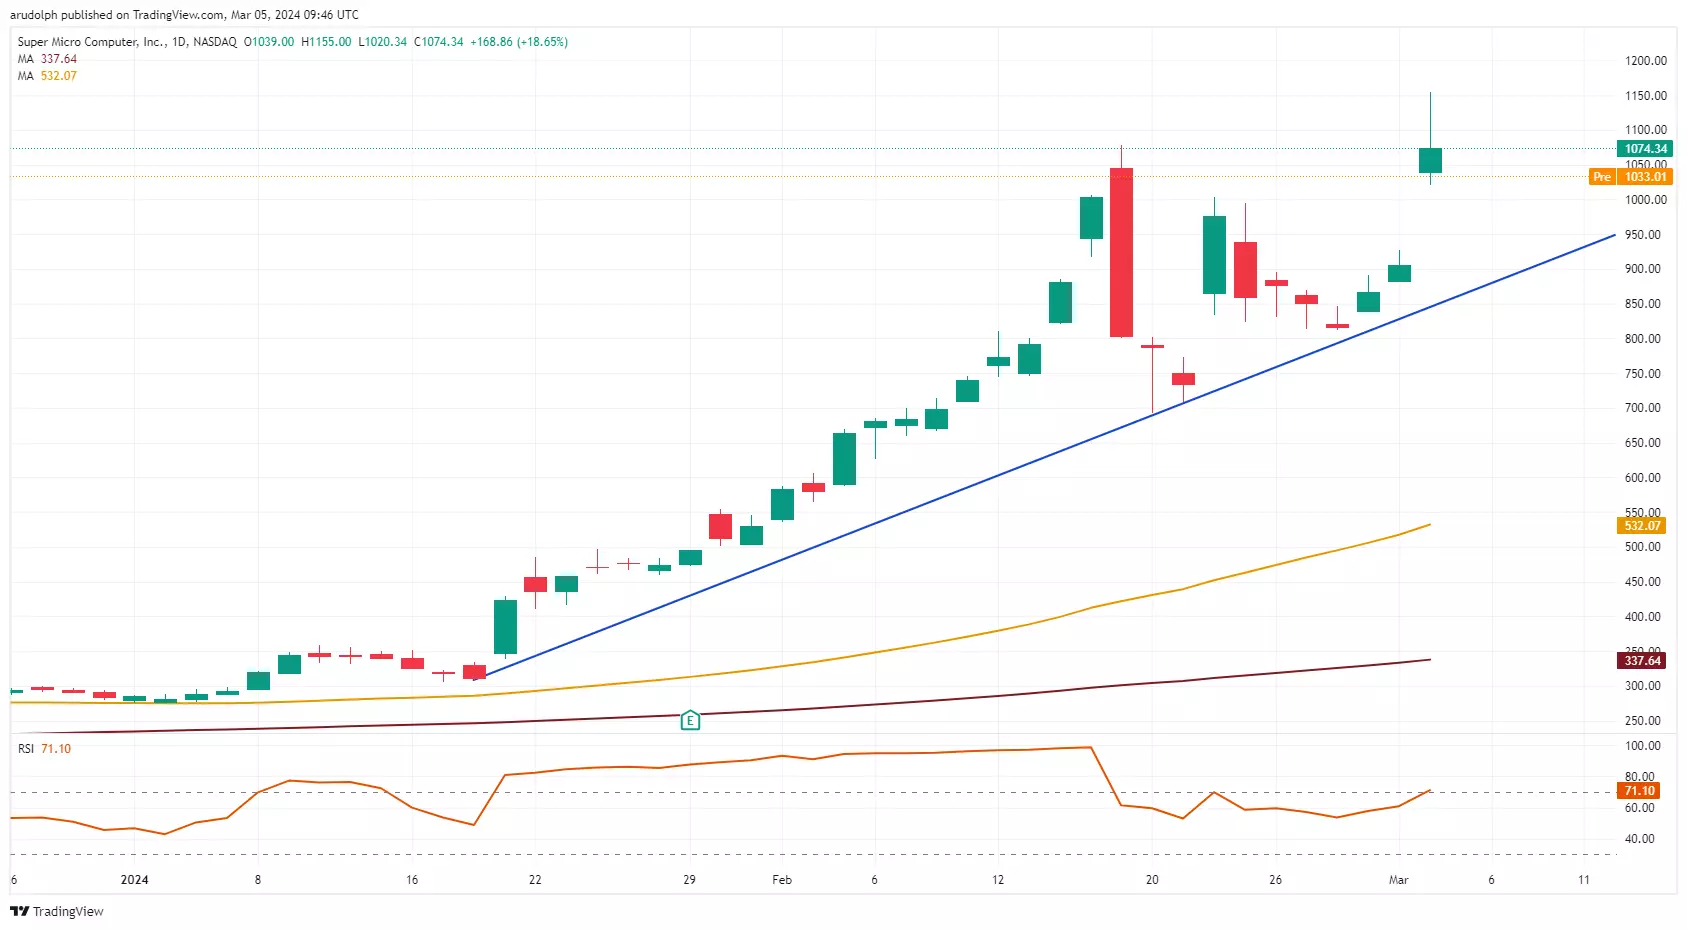
While the January-to-March uptrend line at $846.52 holds, the medium-term uptrend will remain intact.
For a bearish reversal to be seen, a fall through the late-February low at $692.50 would need to ensue. Such a drop in itself would represent a 35% fall in the SMCI share price from Monday’s close.
IGA, may distribute information/research produced by its respective foreign affiliates within the IG Group of companies pursuant to an arrangement under Regulation 32C of the Financial Advisers Regulations. Where the research is distributed in Singapore to a person who is not an Accredited Investor, Expert Investor or an Institutional Investor, IGA accepts legal responsibility for the contents of the report to such persons only to the extent required by law. Singapore recipients should contact IGA at 6390 5118 for matters arising from, or in connection with the information distributed.
The information/research herein is prepared by IG Asia Pte Ltd (IGA) and its foreign affiliated companies (collectively known as the IG Group) and is intended for general circulation only. It does not take into account the specific investment objectives, financial situation, or particular needs of any particular person. You should take into account your specific investment objectives, financial situation, and particular needs before making a commitment to trade, including seeking advice from an independent financial adviser regarding the suitability of the investment, under a separate engagement, as you deem fit.
No representation or warranty is given as to the accuracy or completeness of this information. Consequently, any person acting on it does so entirely at their own risk. Please see important Research Disclaimer.
Please also note that the information does not contain a record of our trading prices, or an offer of, or solicitation for, a transaction in any financial instrument. Any views and opinions expressed may be changed without an update.

Seize a share opportunity today
Go long or short on thousands of international stocks.
- Increase your market exposure with leverage
- Get spreads from just 0.1% on major global shares
- Trade CFDs straight into order books with direct market access
Live prices on most popular markets
- Forex
- Shares
- Indices
See more forex live prices
See more shares live prices
Prices above are subject to our website terms and agreements. Prices are indicative only. All shares prices are delayed by at least 15 mins.
See more indices live prices
Prices above are subject to our website terms and agreements. Prices are indicative only. All shares prices are delayed by at least 20 mins.
