Asia Day Ahead: Rally on pause after stellar start to the week, RBA rate decision in focus
Major US indices drifted higher to start the week amid the lighter front on the economic calendar, but with gains capped by a slight recovery in Treasury yields.

Market Recap
Major US indices drifted higher to start the week amid the lighter front on the economic calendar, but with gains capped by a slight recovery in Treasury yields following three straight days of decline. The VIX remains subdued overnight (-0.13%) but nevertheless, continues to trade at a distance below the key psychological 20 level as a sign of stable risk sentiments.
As markets continue to price for an end to the Federal Reserve (Fed)'s hiking cycle, upcoming Fedspeak will be looked upon as validation to gauge if ‘dovish’ expectations are getting ahead of themselves. Fed official Neel Kashkari has gotten the ball rolling overnight, displaying some reservations towards the end of rate hikes and that ‘the risk of over-tightening monetary policy is preferable to doing too little’. More Fedspeak looms ahead, notably with Fed Chair Jerome Powell due to speak on Wednesday.
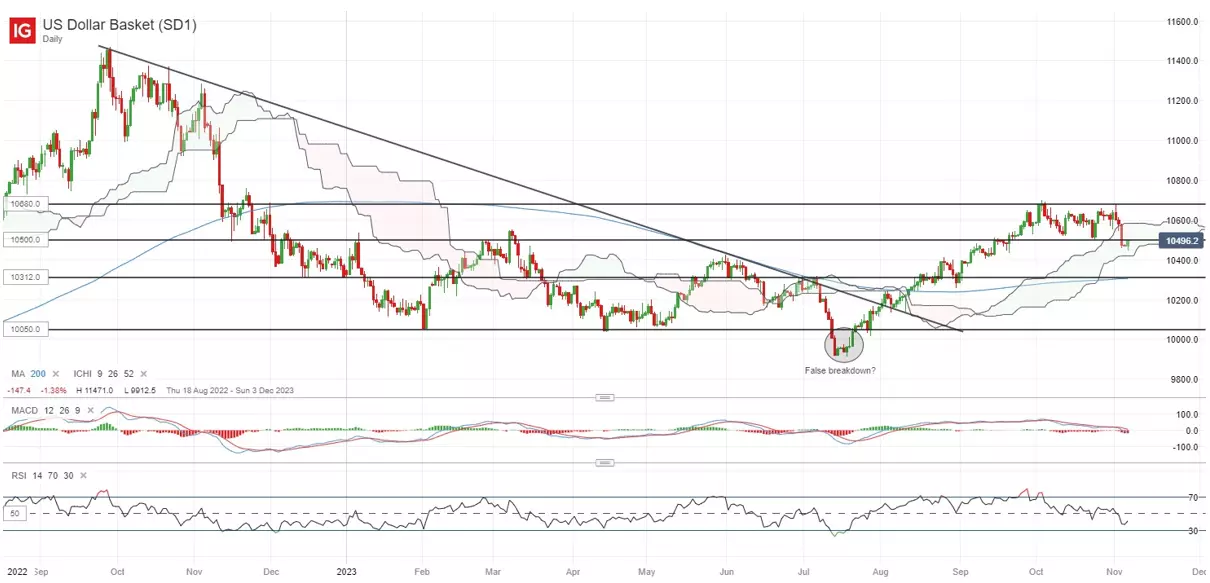
The US dollar is back to retest its previous support-turned-resistance at the 105.00 level overnight, but much still awaits. For now, its daily relative strength index (RSI) continues to trade at its lowest level since July this year, displaying near-term downside momentum. Failure to reclaim the 105.00 level ahead may potentially pave the way to retest the next level of support at the 103.12 level.
Asia Open
Asian stocks look set for a muted open, with Nikkei -0.66%, ASX -0.41% and KOSPI -1.90% at the time of writing. Following the stellar rallies across the region yesterday – the best run in a year, indices are giving back some of their gains, with a recovery in bond yields and a firmer US dollar to start the week.
The economic calendar for the region will be relatively more packed, starting off this morning with a strengthening in Japan’s nominal wage growth (1.2% year-on-year versus 1.0% forecast), but with little signs of recovery in household spending (-2.8% versus -2.7% forecast). That may likely put the Bank of Japan (BoJ) on its cautious track in its policy normalisation process for now, potentially leaning towards having to see more data for conviction in unwinding its ultra-loose monetary stimulus.
Ahead, the Reserve Bank of Australia (RBA) interest rate decision will be on watch. Markets are leaning towards a 25 basis point (bp) hike to bring its cash rate to 4.35%, following the hawkish rhetoric in the previous meeting and the strong run-up in economic data ever since. Focus will be on whether there will be more hikes to follow, or if the hike is a one-off adjustment.
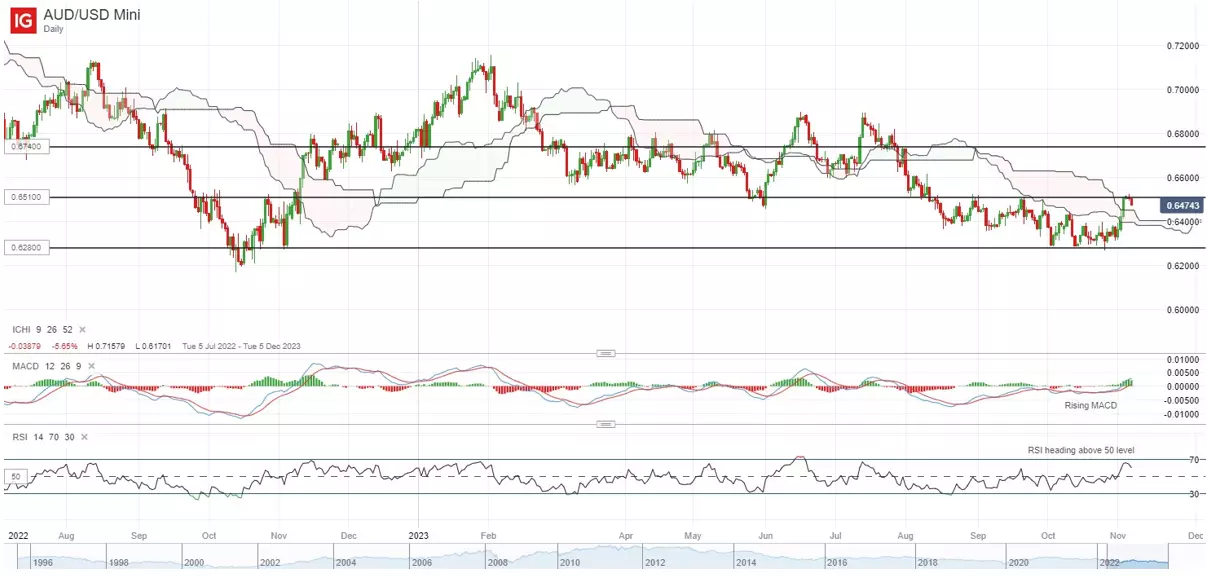
For the AUD/USD, rising moving average convergence/divergence (MACD) above the zero mark and RSI heading above 50 on the daily chart may reflect near-term upside momentum, but the 0.651 level will be an immediate resistance to overcome for the bulls. Any successful move above the 0.651 level may mark a break of the upper resistance of its ranging pattern to drive a move to retest the 0.674 level next.
On the watchlist: Near-term head-and-shoulder formation on watch for gold prices
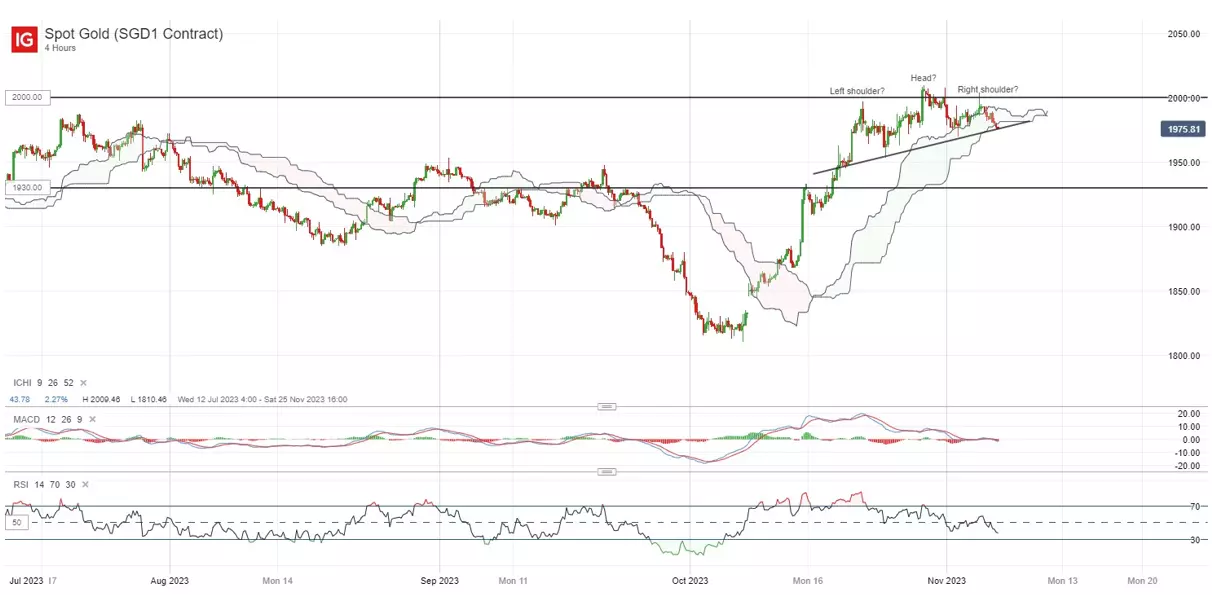
Following a 10% rally since early-October this year, gold prices seem to be displaying some near-term exhaustion lately with the formation of a head-and-shoulder formation on the four-hour chart. Its four-hour RSI has also headed below the key 50 level for the first time since October 2023, which reflects waning upside momentum.
Ahead, the neckline support at the US$1,970 level may be crucial to hold, which coincides with its four-hour Ichimoku cloud support. Any breakdown of the neckline could potentially pave the way to retest the US$1,950 level, followed by the US$1,930 level. On the upside, the psychological US$2,000 level remains as immediate resistance to overcome.
Monday: DJIA +0.10%; S&P 500 +0.18%; Nasdaq +0.30%, DAX -0.35%, FTSE +0.00%
IGA, may distribute information/research produced by its respective foreign affiliates within the IG Group of companies pursuant to an arrangement under Regulation 32C of the Financial Advisers Regulations. Where the research is distributed in Singapore to a person who is not an Accredited Investor, Expert Investor or an Institutional Investor, IGA accepts legal responsibility for the contents of the report to such persons only to the extent required by law. Singapore recipients should contact IGA at 6390 5118 for matters arising from, or in connection with the information distributed.
The information/research herein is prepared by IG Asia Pte Ltd (IGA) and its foreign affiliated companies (collectively known as the IG Group) and is intended for general circulation only. It does not take into account the specific investment objectives, financial situation, or particular needs of any particular person. You should take into account your specific investment objectives, financial situation, and particular needs before making a commitment to trade, including seeking advice from an independent financial adviser regarding the suitability of the investment, under a separate engagement, as you deem fit.
No representation or warranty is given as to the accuracy or completeness of this information. Consequently, any person acting on it does so entirely at their own risk. Please see important Research Disclaimer.
Please also note that the information does not contain a record of our trading prices, or an offer of, or solicitation for, a transaction in any financial instrument. Any views and opinions expressed may be changed without an update.

Seize a share opportunity today
Go long or short on thousands of international stocks.
- Increase your market exposure with leverage
- Get spreads from just 0.1% on major global shares
- Trade CFDs straight into order books with direct market access
Live prices on most popular markets
- Forex
- Shares
- Indices
See more forex live prices
See more shares live prices
Prices above are subject to our website terms and agreements. Prices are indicative only. All shares prices are delayed by at least 15 mins.
See more indices live prices
Prices above are subject to our website terms and agreements. Prices are indicative only. All shares prices are delayed by at least 20 mins.
