Asia Day Ahead: Fed’s hawkish takeaway firms US dollar, while AUD/USD, gold weigh
A high-for-longer rate outlook was the clear takeaway from the recent Fed meeting, as US Treasury yields found the validation to push on further with their 16-year highs.


Market Recap
The Federal Reserve (Fed) kept rates on hold (5.25%-5.5%) at its latest meeting, but delivered a hawkish hold as what markets were anticipating – or rather, more hawkish. The Fed’s dot plot left the door open for one more rate hike by the end of this year as before, but were only looking for two rate cuts in 2024, down from the previous four rate cuts forecasted in June. Similarly, Fed funds rate in 2025 was forecasted to end at 3.9%, higher than the previous 3.4% forecast.
That leaves a high-for-longer rate outlook as the clear takeaway, which called for a hawkish recalibration in rate expectations overnight. While the higher gross domestic product (GDP) and lower unemployment forecasts for 2023 and 2024 do provide more conviction for soft landing hopes, that economic resilience also seems to provide the confidence for Fed Chair Jerome Powell to display a stricter tone in his press conference, which saw some downplaying of inflation progress and that “stronger activity means we (the Fed) have to do more with rates”.
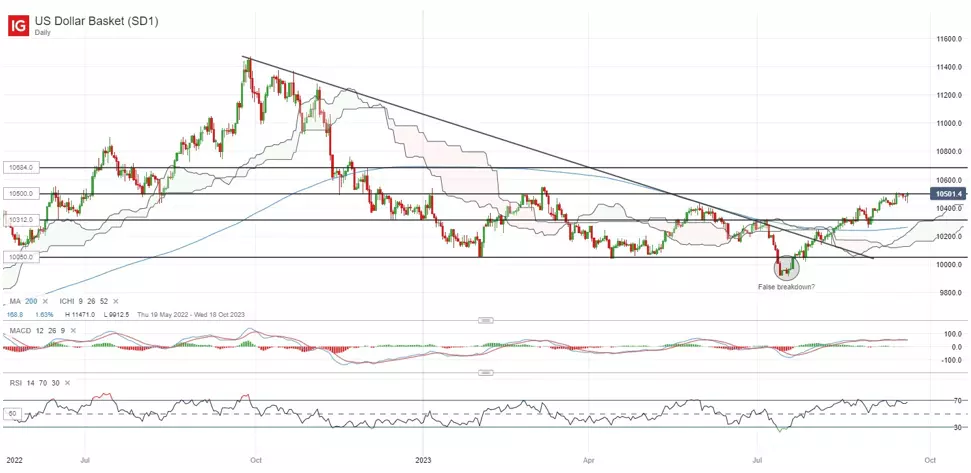
Overnight, US Treasury yields found the validation to push on further with their 16-year highs, allowing the US dollar to reverse earlier losses. With that, the US dollar is heading to reclaim the 105.00 level of resistance with the formation of a bullish pin bar on the daily chart. Further positive follow-through may leave the 106.84 level as the next resistance to overcome. Thus far, its weekly moving average convergence/divergence (MACD) is eyeing for a cross back into positive territory, while its weekly Relative Strength Index (RSI) continues to trade above the key 50 level as a reflection of buyers in broad control.
Asia Open
Asian stocks look set for a downbeat open, with Nikkei -0.61%, ASX -0.46% and KOSPI -1.06% at the time of writing, as de-risking tracks the overnight losses in Wall Street, higher bond yields and a firming in the US dollar. US-listed Chinese stocks were lower overnight as well, with the Nasdaq Golden Dragon China Index down 0.9%, following a downbeat session in the earlier Asian session.
The economic calendar this morning saw a significantly higher-than-expected 2Q GDP in New Zealand (0.9% QoQ vs 0.5% forecast), which brought some resilience for the NZX compared to the rest of the region, but failed to provide much of a boost for the risk-sensitive NZD/USD. Broader risk sentiments will continue to take its cue from the hawkish takeaway in the recent Fed meeting, as we continue to tread in the seasonally weaker period of the year (mid-September to early-October).
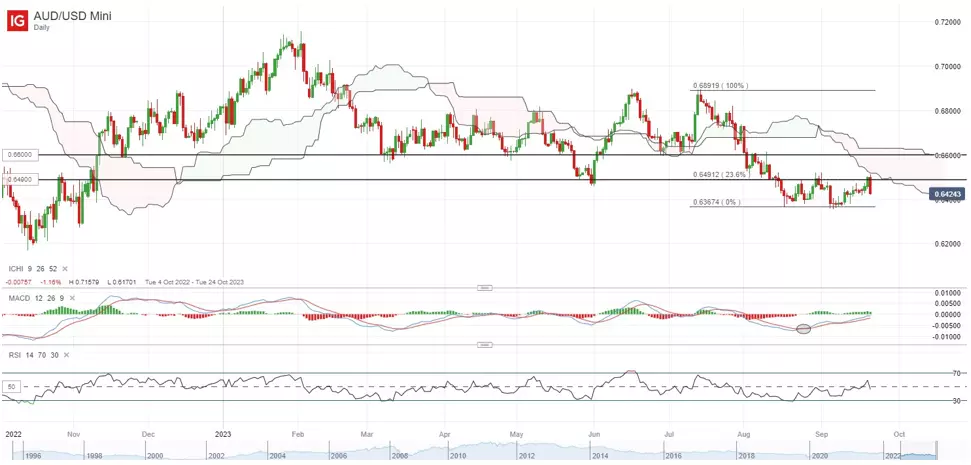
The risk-sensitive AUD/USD has come under pressure as well, with the formation of a bearish engulfing on the daily chart seeking to unwind all of its past week’s gains. A double-bottom formation seems to be in place, with the 0.649 level serving as the key neckline to overcome. Further downside may leave its year-to-date bottom on watch for a retest at the 0.636 level.
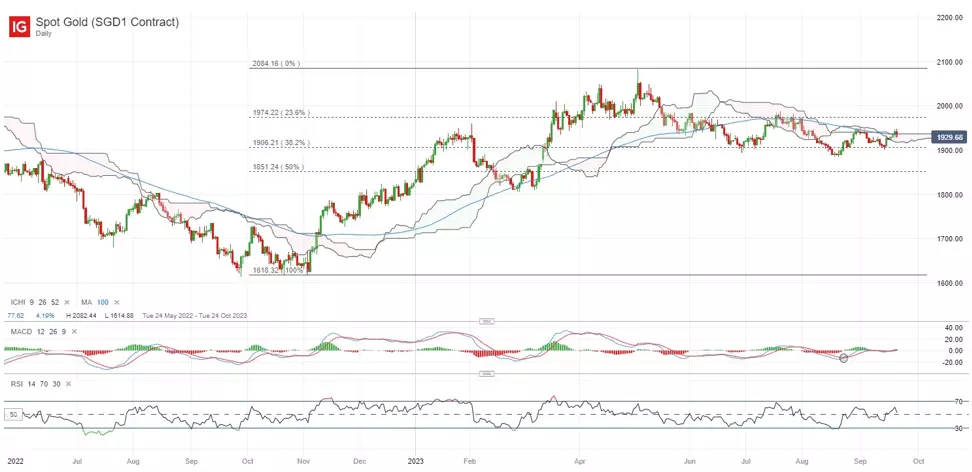
On the watchlist: Gold prices finding resistance from its Ichimoku cloud on the daily chart
Gold prices failed to hold onto initial gains overnight, with the yellow metal finding resistance from its Ichimoku cloud on the daily chart at the US$1,940 level, as Treasury yields headed higher and US dollar firmed in the aftermath of the Fed meeting. This US$1,940 level also marks a confluence with its 100-day moving average (MA), reinforcing the level as a key resistance to overcome for buyers. Thus far, prices have failed to trade above the cloud since its breakdown in June this year, with any further downside likely to leave the US$1,900 level on watch as immediate support to hold.
Wednesday: DJIA -0.22%; S&P 500 -0.94%; Nasdaq -1.53%, DAX +0.75%, FTSE +0.93%
IGA, may distribute information/research produced by its respective foreign affiliates within the IG Group of companies pursuant to an arrangement under Regulation 32C of the Financial Advisers Regulations. Where the research is distributed in Singapore to a person who is not an Accredited Investor, Expert Investor or an Institutional Investor, IGA accepts legal responsibility for the contents of the report to such persons only to the extent required by law. Singapore recipients should contact IGA at 6390 5118 for matters arising from, or in connection with the information distributed.
The information/research herein is prepared by IG Asia Pte Ltd (IGA) and its foreign affiliated companies (collectively known as the IG Group) and is intended for general circulation only. It does not take into account the specific investment objectives, financial situation, or particular needs of any particular person. You should take into account your specific investment objectives, financial situation, and particular needs before making a commitment to trade, including seeking advice from an independent financial adviser regarding the suitability of the investment, under a separate engagement, as you deem fit.
No representation or warranty is given as to the accuracy or completeness of this information. Consequently, any person acting on it does so entirely at their own risk. Please see important Research Disclaimer.
Please also note that the information does not contain a record of our trading prices, or an offer of, or solicitation for, a transaction in any financial instrument. Any views and opinions expressed may be changed without an update.

Seize a share opportunity today
Go long or short on thousands of international stocks.
- Increase your market exposure with leverage
- Get spreads from just 0.1% on major global shares
- Trade CFDs straight into order books with direct market access
Live prices on most popular markets
- Forex
- Shares
- Indices
See more forex live prices
See more shares live prices
Prices above are subject to our website terms and agreements. Prices are indicative only. All shares prices are delayed by at least 15 mins.
See more indices live prices
Prices above are subject to our website terms and agreements. Prices are indicative only. All shares prices are delayed by at least 20 mins.
