Lead-up to US CPI release keeps sentiments in check: US dollar, Hang Seng Index, Brent crude
Wall Street continued its decline for the second straight day, as market participants de-risk in the lead-up to the upcoming US CPI release.

Market Recap
Wall Street continued its decline for the second straight day (DJIA -0.54%; S&P 500-0.70%; Nasdaq -1.17%) with growth sectors bearing the brunt of the sell-off once more, as market participants de-risk in the lead-up to the upcoming US Consumer Price Index (CPI) release. Over the past week, the Nasdaq is down 1.2% versus the S&P 500’s -0.6%. Treasury yields were more mixed overnight, with the two-year yields up 5 basis-point (bp), while the 10-year yields settled close to 4% at its latest issuance.
With the US earnings season winding down, the upcoming US CPI data could dictate the trend over coming weeks, largely seen as a key in determining if a September rate hike is needed. The latest consensus suggests that headline inflation is expected to see a pick-up to 3.3% from previous 3%, while the core aspect may remain unchanged at 4.8%. This will be the first time since August 2022, whereby headline inflation moves higher, with abating base effects to kick in over coming months as well. Month-on-month, both headline and core inflation is expected to rise 0.2%.
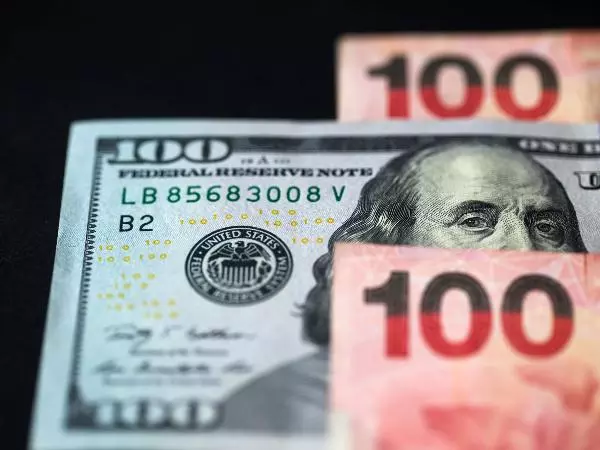
While more data may still be needed to shift policymakers’ views of further tightening needed, any hawkish build-up in rate expectations from any upside inflation surprise may provide an uplift for the US dollar in the near term, while keeping risk sentiments in check. The US dollar will be on watch, having firmed up lately with a 0.5% gain since the start of the week. That said, one to watch may be its weekly relative strength index (RSI), which has failed to cross above its key 50 level since November last year. Failure to overcome the 50 level may still point to the current bounce being a corrective move on its prevailing downward trend. On the upside, the 103.12 level will be a resistance level to watch.

Asia Open
Asian stocks look set for a subdued start, with Nikkei -0.13%, ASX -0.06% and KOSPI -0.55% at the time of writing. Sentiments continue to reel in from China’s deflationary story, which largely validates a low-for-longer growth outlook, while recent US orders to ban certain tech investments in China did not offer sentiments much of a break. Nevertheless, downside in Chinese equities seems more contained lately, as market participants seem to be more accustomed to weak China’s economic data over the past months, while focusing on keeping a lookout for any worst-is-over.
Nevertheless, on the weekly chart, the Ichimoku cloud resistance has once again kept a lid on the Hang Seng Index, with the index briefly crossing its key psychological 20,000 level but failed to find much of a follow-through for now. The weekly RSI continues to hover around the 50 level, potentially denoting some wider indecision in place. On the downside, the 18,460 level will serve as near-term support for the bulls to defend while on the other hand, the 20,000 level is back on the radar as a key resistance to overcome.

On the watchlist: Brent crude prices above 50 level on weekly RSI for first time since July 2022
Oil prices have been resilient to a weak economic showing out of China in recent weeks, with market participants choosing to place their focus on the tighter supplies conditions from Saudi Arabia and Russia’s output cuts to continue its unwind from previous bearish positioning. Recent tensions in the Black Sea just adds to the list of catalysts for bulls to tap on, coupled with views that a more moderate cooling in economic conditions in other parts of the world may continue to support demand.
With the 15.7% gain since July this year, Brent crude prices are now placing its sight for a retest of its year-to-date high around the US$88.40 level. Having traded in a wide consolidation pattern since November last year, the US$88.40 level also marked the upper bound of the range, with any break higher potentially paving the way to retest the US$98.00 level next. More notably, this also marked the first time since July 2022, where its weekly RSI has crossed above the key 50 level, which may support hopes of a potential trend reversal to the upside.

Wednesday: DJIA -0.54%; S&P 500 -0.70%; Nasdaq -1.17%, DAX +0.49%, FTSE +0.80%
IGA, may distribute information/research produced by its respective foreign affiliates within the IG Group of companies pursuant to an arrangement under Regulation 32C of the Financial Advisers Regulations. Where the research is distributed in Singapore to a person who is not an Accredited Investor, Expert Investor or an Institutional Investor, IGA accepts legal responsibility for the contents of the report to such persons only to the extent required by law. Singapore recipients should contact IGA at 6390 5118 for matters arising from, or in connection with the information distributed.
The information/research herein is prepared by IG Asia Pte Ltd (IGA) and its foreign affiliated companies (collectively known as the IG Group) and is intended for general circulation only. It does not take into account the specific investment objectives, financial situation, or particular needs of any particular person. You should take into account your specific investment objectives, financial situation, and particular needs before making a commitment to trade, including seeking advice from an independent financial adviser regarding the suitability of the investment, under a separate engagement, as you deem fit.
No representation or warranty is given as to the accuracy or completeness of this information. Consequently, any person acting on it does so entirely at their own risk. Please see important Research Disclaimer.
Please also note that the information does not contain a record of our trading prices, or an offer of, or solicitation for, a transaction in any financial instrument. Any views and opinions expressed may be changed without an update.

Seize a share opportunity today
Go long or short on thousands of international stocks.
- Increase your market exposure with leverage
- Get spreads from just 0.1% on major global shares
- Trade CFDs straight into order books with direct market access
Live prices on most popular markets
- Forex
- Shares
- Indices
See more forex live prices
See more shares live prices
Prices above are subject to our website terms and agreements. Prices are indicative only. All shares prices are delayed by at least 15 mins.
See more indices live prices
Prices above are subject to our website terms and agreements. Prices are indicative only. All shares prices are delayed by at least 20 mins.
