Asia Day Ahead: China’s inflation data disappoints, wait-and-see in lead-up to US CPI
Most part of the Asia region are stuck in some wait-and-see ahead of the US CPI report tomorrow, which may play a crucial role in determining the tone from Fed policymakers at the upcoming meeting.


Market Recap
A sturdy set of job numbers out from the US brought some slight paring in rate-cut bets last Friday, but that failed to dent the appetite in equities, which saw the resilient labour market as further validation for soft-landing hopes. The S&P 500 made its way to its highest year-to-date close, breaking higher after a period of indecision since late-November, while the VIX remained at its year-to-date low as the risk-on environment prevails.
US November job additions were higher-than-expected (199,000 versus 180,000 consensus) while unemployment rate ticked lower to 3.7% from previous 3.9%. Average hourly earnings were also higher-than-expected at 0.4% month-on-month versus the 0.3% consensus. Nevertheless, it may still have to take a consistent trend of higher inflation and stronger labour conditions to prompt the Federal Reserve (Fed) to consider additional tightening and until then, ‘good news’ may be viewed from the soft-landing camp.
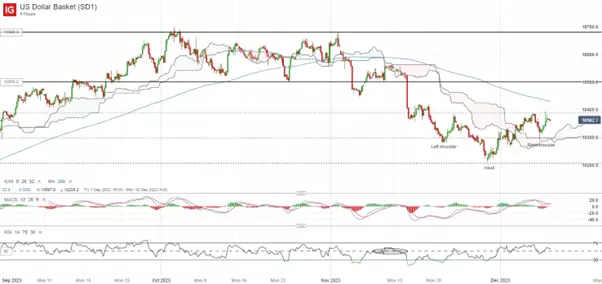
Eyes will be focused on the US Consumer Price Index (CPI) data tomorrow, where subdued inflationary pressures are likely to be the story once more. For now, the US dollar has managed to stay supported above its 200-day moving average (MA) to end last week, alongside the recovery in US Treasury yields to end last week. On the four-hour chart, an inverse head-and-shoulder formation has been presented with the neckline resistance at the 103.85 level. Any successful move above the neckline may help to pave the way towards the 105.00 level, while on the downside, the 103.00 level will serve as immediate support to hold.
Asia Open
Asian stocks look set for a mixed open, with Nikkei +1.65%, ASX +0.21% and KOSPI +0.06% at the time of writing. Most part of the region are stuck in some wait-and-see ahead of the US CPI report tomorrow, which may play a crucial role in determining the tone from Fed policymakers at the upcoming meeting. The Nikkei 225 may shine with an eye-catching 1.65% up-move, as the sharp appreciation in the Japanese yen moderates, leading Japanese equities to pare back on previous losses.
Over the weekend, China’s inflation data did not provide much to cheer, as a deeper-than-expected contraction in consumer prices continues to highlight the struggle in the world’s second largest economy in stabilising its growth. The 0.5% year-on-year contraction in consumer prices versus the 0.1% contraction consensus reflects the fastest slide since November 2020 on weak Chinese consumer demand. Producer prices were lower-than-expected at -3.0% year-on-year as well, overall reinforcing calls for more to be done by authorities once more.
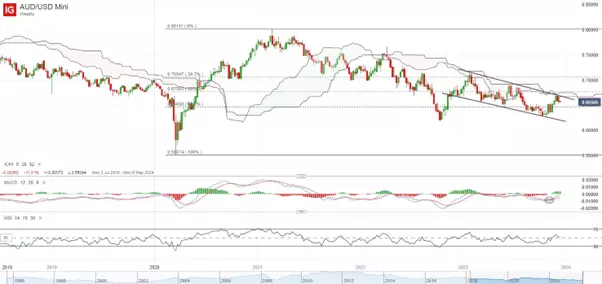
The rally in the AUD/USD is now finding some near-term resistance at its weekly Ichimoku cloud zone around the 0.667 level, with weaker data out of China leading the pair lower to start the week. Buyers may watch for an eventual move above the Ichimoku cloud resistance on the weekly chart to further support a trend reversal to the upside, given that the pair has failed to overcome the cloud resistance on at least four previous occasions since March 2022. On the downside, the 0.650 level will serve as immediate support to hold.
On the watchlist: Brent crude attempting to recover from previous sell-off
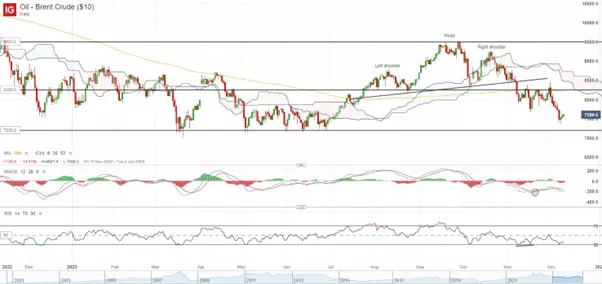
Brent Crude prices are attempting to recover lately after a 10% sell-off since end-November this year, with some support from US soft-landing hopes and the risk-on environment, although gains were still somewhat capped into the new week on China’s demand concerns. For now, there could be some near-term support for prices as some bets may be in place that the current price level may prompt some replenishing of the US Strategic Petroleum Reserve (SPR) stockpile, but whether this marks the ‘true’ floor for oil prices remains to be seen, given the absence of a clear recovery in China’s growth conditions while the trend in US oil inventories data so far did not support a wider supply-demand deficit.
Prices could attempt to recover to the US$77.84 level, where heavy resistance may be presented. In the event where prices failed to follow through with recent gains, the year-to-date bottom at the US$72.00 may be in sight for a retest, which will be a crucial support to defend with prices supported at this level on at least five previous occasions.
Friday: DJIA +0.36%; S&P 500 +0.41%; Nasdaq +0.45%, DAX +0.78%, FTSE +0.54%
IGA, may distribute information/research produced by its respective foreign affiliates within the IG Group of companies pursuant to an arrangement under Regulation 32C of the Financial Advisers Regulations. Where the research is distributed in Singapore to a person who is not an Accredited Investor, Expert Investor or an Institutional Investor, IGA accepts legal responsibility for the contents of the report to such persons only to the extent required by law. Singapore recipients should contact IGA at 6390 5118 for matters arising from, or in connection with the information distributed.
The information/research herein is prepared by IG Asia Pte Ltd (IGA) and its foreign affiliated companies (collectively known as the IG Group) and is intended for general circulation only. It does not take into account the specific investment objectives, financial situation, or particular needs of any particular person. You should take into account your specific investment objectives, financial situation, and particular needs before making a commitment to trade, including seeking advice from an independent financial adviser regarding the suitability of the investment, under a separate engagement, as you deem fit.
No representation or warranty is given as to the accuracy or completeness of this information. Consequently, any person acting on it does so entirely at their own risk. Please see important Research Disclaimer.
Please also note that the information does not contain a record of our trading prices, or an offer of, or solicitation for, a transaction in any financial instrument. Any views and opinions expressed may be changed without an update.

Seize a share opportunity today
Go long or short on thousands of international stocks.
- Increase your market exposure with leverage
- Get spreads from just 0.1% on major global shares
- Trade CFDs straight into order books with direct market access
Live prices on most popular markets
- Forex
- Shares
- Indices
See more forex live prices
See more shares live prices
Prices above are subject to our website terms and agreements. Prices are indicative only. All shares prices are delayed by at least 15 mins.
See more indices live prices
Prices above are subject to our website terms and agreements. Prices are indicative only. All shares prices are delayed by at least 20 mins.
