What is a Commodity Channel Index pattern?
The Commodity Channel Index (CCI) is a useful indicator for traders to identify a market trend’s momentum. You can use the data to predict future price changes. Find out more about what the CCI is and how it works.


What's on this page
What is the Commodity Channel Index indicator?
The Commodity Channel Index (CCI) indicator measures an asset’s current price compared to the average price level established over a given period of time. It tracks the momentum of current price highs and lows relative to the statistical mean to determine the development of new trends in the market.
When the CCI is higher compared to the historical average, it indicates that the asset price is above the average level. Conversely, if it’s low, the price will be below the average observed over a certain period of time.
Despite its name, the CCI can be used as an indicator in any market. You can also use it to gain exposure to shares, forex and other markets with us.
The CCI was created by Donald Lambert, a renowned technical analyst who first published the indicator in Commodities magazine (now known as Futures) in 1980. He initially developed the index to identify long-term cycles in commodity markets, but it has since been used by traders who have a short-term outlook on different securities.
What pattern does the Commodity Channel Index identify?
The CCI identifies a pattern that indicates an opportunity for traders to take a position. Looking at price charts, you can use it to identify price divergence – overbought or oversold levels – in an asset, reversals to the mean and trend indicators that display a particular pattern.
Technical analysts use the CCI to spot different harmonic patterns in price fluctuations that help to determine the entry and exit points when trading.
Additionally, the CCI enables you to track momentum shifts in various directions and volume indicators over a given period of time to determine if a pattern is developing.
What does the Commodity Channel Index tell traders?
The Commodity Channel Index tells traders the beginning of an upswing or downswing in the price level of an asset to spot emerging cyclical trends. This is achieved through comparing the current price to the historical average price over a specific period of time.
Typically, the index price will fluctuate above or below the zero level, indicating movement towards a positive or negative trajectory. Since 70% to 80% of the CCI values fall between +100 and −100, it means only around 20% to 30% of the values will fall outside the range that will signal an opportunity to buy or sell a market.
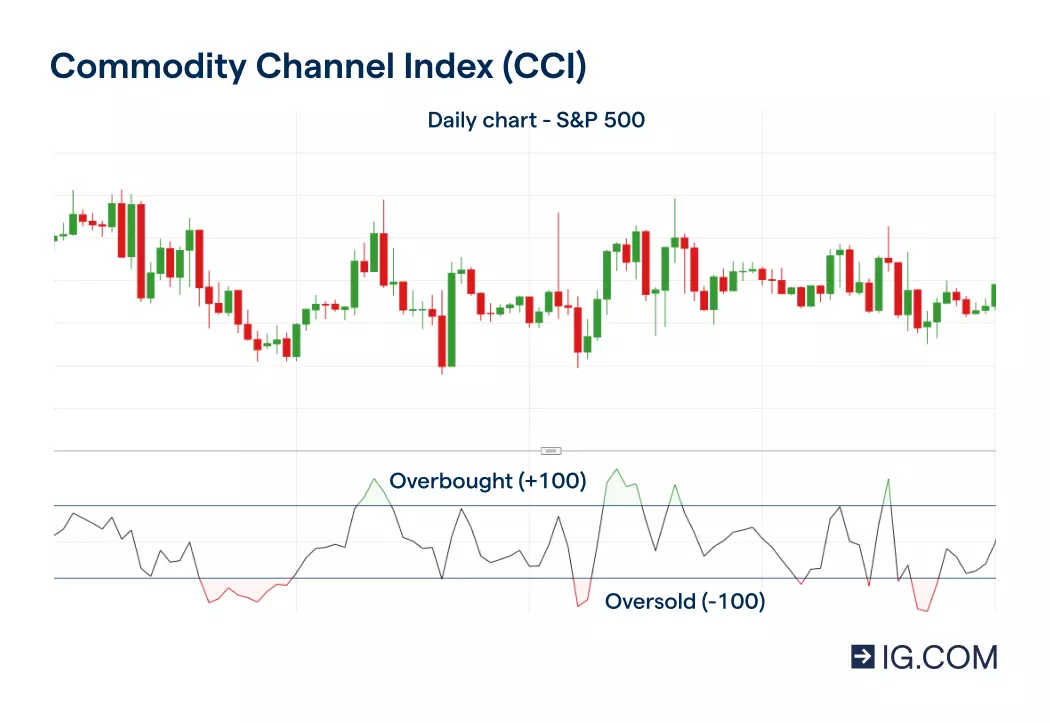
When the CCI moves above +100, the financial instrument’s level will signal an upward trend and provide traders a buying opportunity. Conversely, when the CCI moves below −100, a downturn in the level of the asset’s price will be observed and there will be a signal to sell.
How is the CCI indicator calculated?
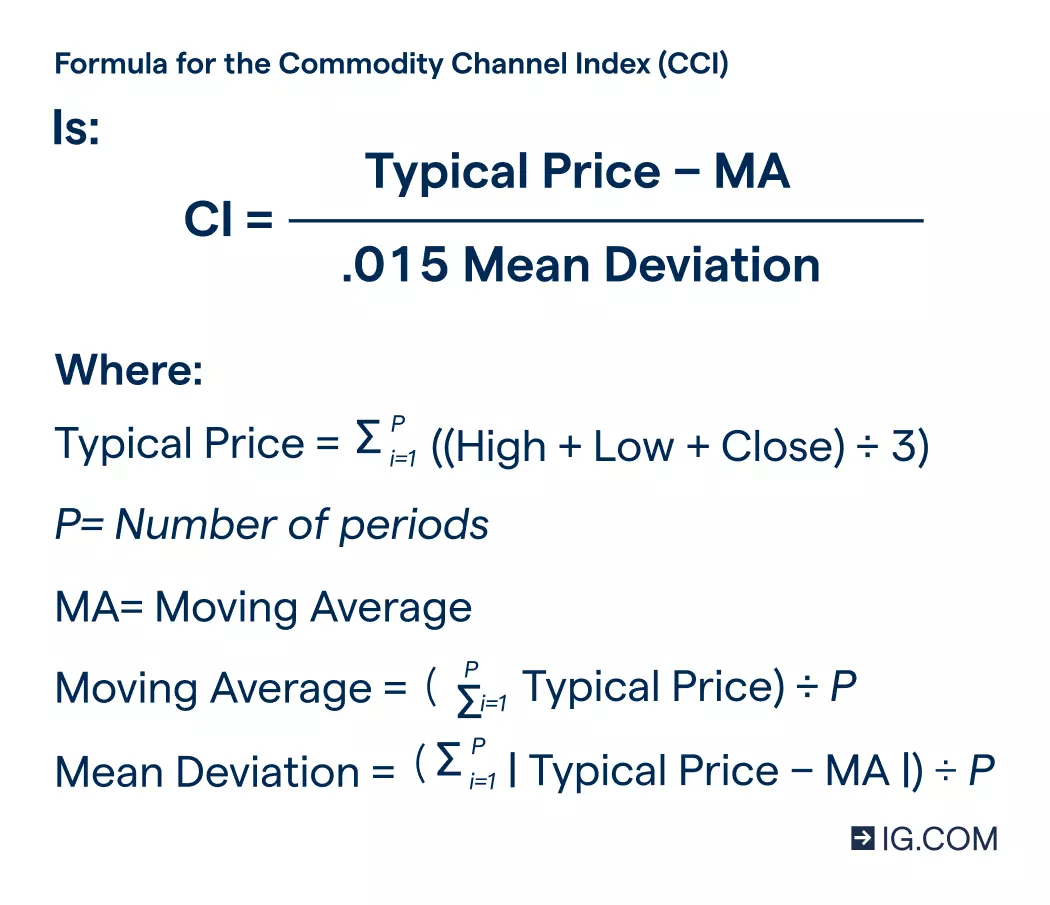
The CCI indicator is calculated using the typical price and its simple moving average, divided by the average price over a specific time period. The calculation compares the difference between the average price of a security and the average price level over a particular timeframe.
Lambert set the constant at 0.015 for scaling purposes, to ensure that approximately 70% to 80% of CCI values would fall between −100 and +100. You multiply the constant and the mean deviation to make the outcome readable.
How to use Commodity Channel Index in trading
You can use the Commodity Channel Index to identify new trends developed in a market. Depending on the period you enter, you will be able to determine the level of volatility in a market at a given time.
For example, a shorter CCI will be more volatile with a smaller percentage of values between +100 and -100. Conversely, a longer CCI will have a higher percentage of values between +100 and -100.
How do you use the Commodity Channel Index when day trading?
The CCI is a useful indicator for day trading as it allows you to determine the levl of volatility in the market prior to your intraday exposure. You can track the average price changes of the market in shorter timeframes to spot emerging trends, pick up pullbacks in the price level, and determine entry and exit points within the same day.
Day traders monitor charts with different candlestick patterns, looking for opportunities to buy and sell financial instruments within a day – closing out positions at the end of each day.
The daily chart patterns can support someone with a short-term outlook, you can take a long position (buy) when the CCI value hits below –100 and rallies back above –100. You can earn a profit if the market has an upward trend, and conversely, get a loss if it continues to drop.
Please note that due to the volatility of the daily charts, it is important to exit your position once the CCI value moves above +100 before it dips again. You need to be quick as the values fall outside –100 and +100 only 20% to 30% of the time.
There are different day trading strategies that you can use to take your position, including scalping, money flows, mean reversion, swing trading and trend trading.
Learn more about the ins and outs of day trading
How do you use the Commodity Channel Index when trading forex?
The Commodity Channel Index indicator can be useful when trading forex, as it helps to identify whether a currency pair is overbought or oversold over a specific period of time. Additionally, you can use the indicator to identify the strength or weakness of the trend in the market traded.
You can monitor the CCI in relation to the performance of a certain currency against another over a given period, to identify if there is a pattern of observed momentum in a particular cycle. Once you spot the level that signals the direction that the market will take, you’ll open you position accordingly.
How do you use the Commodity Channel Index when trading commodities?
When you want to take a position on a commodity, you can use the indicator to identify short- or long-term trends.
Since commodities can be affected by seasonal cycles and weather patterns – which can be predicted to an extent – you check the level the current price deviates from the average mean to determine the direction that the market will take.
You can study the overbought and oversold levels of different commodities to take a position on the spot (cash) price, futures or options.
With us, you can predict using Contract for Differences (CFDs)*. These derivatives are leveraged, which means you only need to put up a fraction of the full value of the position to get exposure.
Note that both your profit and loss will be calculated using the full position size, not just your initial deposit. You will need to take steps to manage your risk effectively.
Here are a few steps you’ll take to open your position with us:
- Log in to your trading account
- Search the asset you want to trade in the finder panel
- Input your position size
- Choose ‘buy’ or ‘sell’ in the deal ticket
- Confirm the trade
You can practise using the CCI Indicator and place trades on our risk-free demo account. This tool simulates the market environment in real time, giving you full functionality of our platform, including all of our technical indicators. Once you’ve built up your confidence in using the indicator, you can open a live account and start trading using real money.
Commodity Channel Index (CCI) vs Relative Strength Index (RSI)
While the CCI is an indicator used to determine conditions that give rise to the market being overbought or oversold, you can use another tool to track the momentum in the direction that the market is moving.
The Relative Strength Index (RSI) is a different technical indicator that measures the speed and fluctuation of an asset’s price movement. The RSI values range from 0 to 100, with an uptrend (low RSI) crossing the 70 reference level signalling an opportunity to short, while crossing the 30 reference level(high RSI) indicating a long trade.
You can use both of these indicators interchangeably since they are momentum oscillators. This means that you can identify patterns of emerging trends or price divergences, which can offer opportunities to take a position.
Commodity Channel Index summed up
- The Commodity Channel Index (CCI) measures the assets price in comparison to the average price level established over a given period of time
- The CCI can help traders identify the overbought or oversold levels in a market and signal an opportunity to take a position
- Traders use the CCI to indicate new trends emerging in several securities as well as different timeframes
- With us, you can use CFDs to take a position on different markets using the CCI indicator
- The difference between the CCI and the Relative Strength Index (RSI) is that one tracks the deviation of the current price from the moving average price level while another monitors the speed of price changes to identify overbought and oversold conditions
*CFDs are leveraged products. Trading CFDs may not be suitable for everyone and can result in losses that exceed your deposits. Please ensure that you are fully understand the risks involved.
IGA, may distribute information/research produced by its respective foreign affiliates within the IG Group of companies pursuant to an arrangement under Regulation 32C of the Financial Advisers Regulations. Where the research is distributed in Singapore to a person who is not an Accredited Investor, Expert Investor or an Institutional Investor, IGA accepts legal responsibility for the contents of the report to such persons only to the extent required by law. Singapore recipients should contact IGA at 6390 5118 for matters arising from, or in connection with the information distributed.
The information/research herein is prepared by IG Asia Pte Ltd (IGA) and its foreign affiliated companies (collectively known as the IG Group) and is intended for general circulation only. It does not take into account the specific investment objectives, financial situation, or particular needs of any particular person. You should take into account your specific investment objectives, financial situation, and particular needs before making a commitment to trade, including seeking advice from an independent financial adviser regarding the suitability of the investment, under a separate engagement, as you deem fit.
Please see important Research Disclaimer.

Explore the markets with our free course
Discover and learn how the range of markets you can trade on with IG Academy's online course – ‘Introducing the financial markets’.
Put learning into action
Try out what you’ve learned in this shares strategy article risk-free in your demo account.
Ready to trade shares?
Put the lessons in this article to use in a live account – upgrading is quick and easy.
- Trade on over 10,000 popular global stocks
- Protect your capital with risk management tools
- React to breaking news with out-of-hours trading on 70 key US stocks
Inspired to trade?
Put your new knowledge into practice. Log in to your account now.
