What causes share prices to change?
Like all assets, share prices change as a result of shifts in supply and demand. Here we examine the key drivers behind supply and demand for stocks to explain what causes share prices to rise and fall.

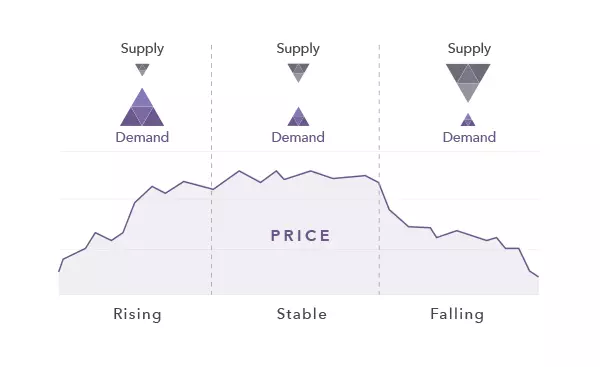
The main factors that determine whether a share price moves up or down are supply and demand. Essentially, if more people want to buy a share than sell it, the price will rise because the share is more sought-after (the 'demand' outstrips the 'supply'). On the other hand, if supply is greater than demand, then the price will fall.
How supply and demand affect share prices
Supply and demand affects the appeal – and, ultimately, the price – of shares. While it might appear that there are other factors at play, such as the health of the economy and company earnings, these are really just drivers of supply and demand.
This means, even if you think a stock is over or undervalued, the market decides what it’s worth. It’s all about the dynamic between buyers and sellers.
If more buyers move into the market, the demand grows and share prices go up – especially if there is limited supply. If supply and demand are just about equal, the share price is likely to move around in a narrow range for a while, until one of the factors outweighs the other.
Supply factors that affect share prices
Supply factors that affect share prices include company share issues, share buybacks and sellers. It’s important to note that share prices will come down when supply is greater than demand, and when more investors start to sell.
Company share issues
A share issue is when a company releases new shares to the public. In other words, when it makes shares available for purchase. There is always a limited number of shares in circulation for any given company, so if lots of investors want to buy a share and the supply is low, the share price will increase.
Share buyback
A share buyback is when a company buys back its own shares from investors to reduce supply. Once this happens, the shares are either cancelled or kept for redistribution in the future. A share buyback reduces the total number of shares in circulation, which could increase the share price as well as the company’s earnings per share (EPS).
Sellers
Sellers are the investors responsible for pushing shares back into the market, increasing the supply. They normally sell to make a profit, when they expect a reversal, or when they think the share is losing too much value. If demand doesn’t match the increased supply, the price will go down. Equally, if there are more buyers than sellers, the price will rise.
Demand factors that affect share prices
Demand factors that can affect share prices include company news and performance, economic factors, industry trends, market sentiment and unexpected events such as natural disasters.
Demand gives shares value. If there is no demand for a company’s shares, they will have no value.
Expected and unexpected company news
Any news surrounding a company – expected or unexpected – can cause movement in its share price. For example, an earnings report that reveals significant profit, a new product launch, missed targets, or the death or departure of a key figure could all lead to swings in demand and share prices. Even natural disasters can cause business disruption and increase a company’s debt, meaning less demand.
Economic factors
Economic factors including interest rate changes, financial outlook and inflation all affect share prices. If the interest rate and inflation go up, and the economic outlook is poor, demand will usually decrease, and the share price is likely to come down.
Industry trends
Industry trends often determine the price of shares because companies in the same industry often perform similarly and are subject to the same pressures. So, when an industry is booming, share demand in that specific sector will often increase, pushing share prices up. It’s also possible for demand of one company’s shares to increase if a competitor is doing poorly.
Market sentiment
Market sentiment refers to the overall feeling that traders have about an asset. Understanding market sentiment can be a powerful tool for an investor. It can often be purely psychological, as investors are influenced by the mood in the markets instead of concrete news or figures. It can also be quite subjective and assumptive, but can be used to inform fundamental and technical analysis to estimate changes in share prices.
How to analyse share price changes
To analyse share price changes, you can employ fundamental and technical analysis. By using analysis as part of your trading strategy, you can predict further share price changes and find trading opportunities.
Fundamental analysis
Fundamental analysis is an in-depth method of studying a company’s financials and external factors to gauge the value of its shares. Fundamental analysis often uses various ratios to determine the value of stock and gauge price movements, such as the price-earnings ratio (P/E), relative dividend yield and return on equity (ROE).
Technical analysis
Technical analysis is a means of using historical charts to predict share price changes. Historical prices are a helpful way of predicting future prices. If traders can familiarise themselves with past patterns, they can recognise the patterns if they appear again. Though, these patterns could have formed under special circumstances, so they are not always the most reliable indicator.
To learn more about technical and fundamental analysis, visit IG Academy.
This information has been prepared by IG, a trading name of IG Markets Limited. In addition to the disclaimer below, the material on this page does not contain a record of our trading prices, or an offer of, or solicitation for, a transaction in any financial instrument. IG accepts no responsibility for any use that may be made of these comments and for any consequences that result. No representation or warranty is given as to the accuracy or completeness of this information. Consequently any person acting on it does so entirely at their own risk. Any research provided does not have regard to the specific investment objectives, financial situation and needs of any specific person who may receive it. It has not been prepared in accordance with legal requirements designed to promote the independence of investment research and as such is considered to be a marketing communication. Although we are not specifically constrained from dealing ahead of our recommendations we do not seek to take advantage of them before they are provided to our clients. See full non-independent research disclaimer and quarterly summary.

Explore the markets with our free course
Learn how shares work – and discover the wide range of markets you can spread bet on – with IG Academy's free ’introducing the financial markets’ course.
Put learning into action
Try out what you’ve learned in this shares strategy article risk-free in your demo account.
Ready to trade shares?
Put the lessons in this article to use in a live account – upgrading is quick and easy.
- Trade on over 13,000+ popular global stocks
- Protect your capital with risk management tools
- React to breaking news with out-of-hours trading on 70 key US stocks
Inspired to trade?
Put your new knowledge into practice. Log in to your account now.