Heikin Ashi definition
What is Heikin Ashi?
Heikin Ashi is a type of chart pattern used in technical analysis. Heikin Ashi charts are similar to candlestick charts, but the main difference is that a Heikin Ashi chart uses the daily price averages to show the median price movement of an asset.
Learn more about technical analysis
Discover the benefits of technical analysis and how it is different to fundamental analysis.
Heikin Ashi formula
The bars in a Heikin Ashi chart are calculated from an average of the open, close, high and low of previous trading sessions. Some Heikin Ashi formulas or calculations are very complicated. Here’s a simplified version of how to:
- Calculate the open = (open of previous bar + close of previous bar) divided by 2
- Calculate the close = (open + close + high + low of current bar) divided by 4
- Calculate the high = the maximum value from the high, open, or close of the current period
- Calculate the low = the minimum value from the low, open, or close of the current period
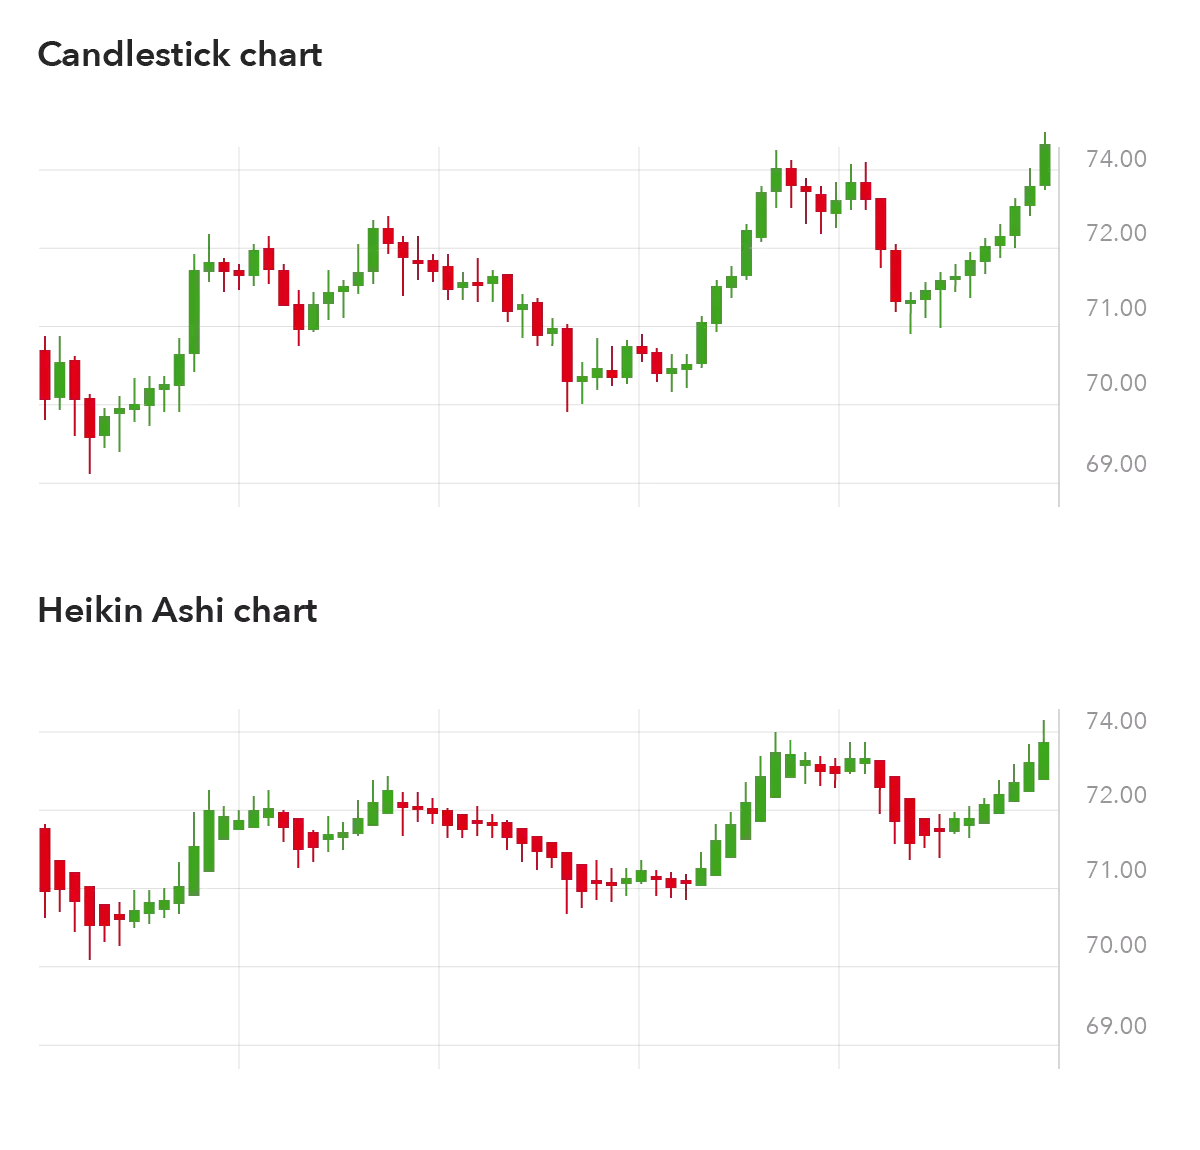
Example of Heikin Ashi
The below chart gives a visual representation of the differences between a candlestick chart and a Heikin Ashi chart. Most noticeably the Heikin Ashi appears smoother, making it a little easier to see the direction of the overall trend.
Why are Heikin Ashi charts used in trading?
Heikin Ashi charts work off average values, which results in a smooth appearance. Some traders consider Heikin Ashi charts to be a more accurate measure of an overall trend than candlestick charts.
Heikin Ashi charts are used as a form of technical analysis to look at an asset’s price movements with regard to an overall trend.
By being able to see the overall trend more clearly, a trader can make a better-informed decision about whether to enter or exit a trade.
This being said, Heikin Ashi charts can be used to the same time values as regular candlestick charts, making them useful as part of a scalping, day or position trading strategy.
Build your trading knowledge
Discover how to trade with IG Academy, using our series of interactive courses, webinars and seminars.
Contact us
New client: +65 6390 5133 or accountopening@ig.com.sg
Clients: Help and support

WhatsApp: Click here