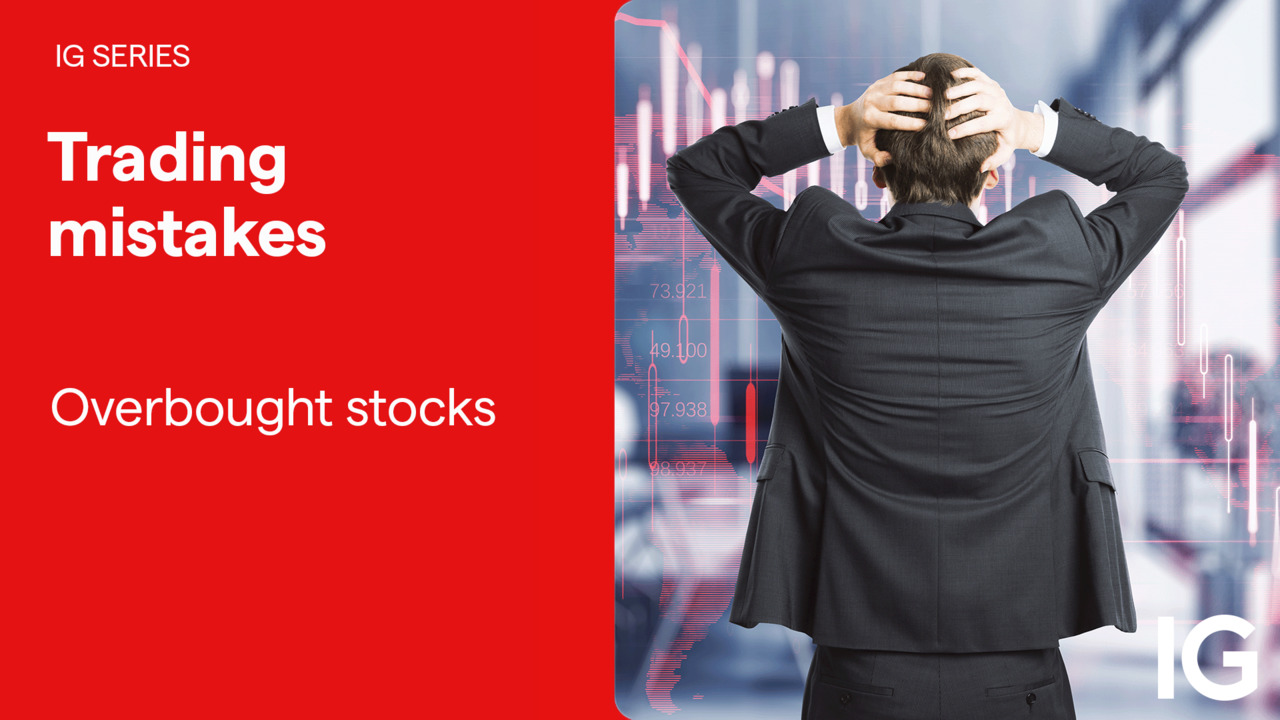
Trading Mistakes: overbought stocks
IG's senior market analyst Axel Rudolph discusses with IGTV's Angeline Ong how to help spot overbought stocks and what to consider when in this territory.


(Video summary)
The common mistakes new investors make when interpreting trading charts
In this video, Angeline Ong explains some common mistakes that new investors make when interpreting trading charts. She is joined by senior market analyst Axel Rudolf, who provides examples to help understand these misconceptions.
One such example is Tesla's daily chart, where Axel shows the Relative Strength Index (RSI), represented by a line in orange at the bottom. The RSI reflects the behavior of the market or asset it represents. It increases when the market goes up and decreases when it goes down. When the RSI falls below 30%, it is considered oversold.
In the Tesla chart, the share price dropped to around $150 in April, indicating an oversold condition. However, the share price then experienced a rally and increased. This shows us that buying when an asset is oversold can lead to profitable outcomes.
On the right side of the chart, we can see that the RSI is above 70%, suggesting an overbought condition. Despite this, the Tesla share price continues to rise. If someone had sold their shares when the asset started becoming overbought at around $200, they would have missed out on the subsequent increase to nearly $280. This provides a clear example that solely relying on overbought or oversold indicators can result in missed opportunities or even financial losses.
The importance of comprehensive analysis in trading decisions
Axel concludes by emphasising the importance of considering other factors alongside indicators. Traders should not automatically sell an asset just because it's overbought or buy solely because it's oversold. This highlights the need for a comprehensive analysis and evaluating multiple indicators before making any trading decisions. Remember, trading is not just about one indicator but a combination of several factors that need to be considered.
This information has been prepared by IG, a trading name of IG Markets Ltd and IG Markets South Africa Limited. In addition to the disclaimer below, the material on this page does not contain a record of our trading prices, or an offer of, or solicitation for, a transaction in any financial instrument. IG accepts no responsibility for any use that may be made of these comments and for any consequences that result. No representation or warranty is given as to the accuracy or completeness of this information. Consequently any person acting on it does so entirely at their own risk. Any research provided does not have regard to the specific investment objectives, financial situation and needs of any specific person who may receive it. It has not been prepared in accordance with legal requirements designed to promote the independence of investment research and as such is considered to be a marketing communication. Although we are not specifically constrained from dealing ahead of our recommendations we do not seek to take advantage of them before they are provided to our clients. See full non-independent research disclaimer and quarterly summary.

Seize a share opportunity today
Go long or short on thousands of international stocks.
- Increase your market exposure with leverage
- Get spreads from just 0.1% on major global shares
- Trade CFDs straight into order books with direct market access
Live prices on most popular markets
- Forex
- Shares
- Indices
Prices above are subject to our website terms and agreements. Prices are indicative only