English
Beghelli SpA
BE.MI- Cost and details
- Related markets
Why IG?
Go long or short on over 13,000 shares
Get direct market access (DMA)
Trade share CFDs
Discover opportunity in-platform
Open a free, no-risk demo account to stay on top of market movement and important events.

Reuters news feed
React to the latest company news and analysis in-platform, where you need it
Three types of alert
Be notified when a stock's price changes an amount, hits a level or meets your technical conditions
Economic calendar
Plan your trades around earnings announcements, dividend payments and more, with customisable alerts to remind you ahead of time
Real-time charts
Analyse price action on fast, reliable HTML5 charts with 25+ indicators
Beghelli SpA news and strategies from IG
Dow finds support as EUR/JPY rises, US natural gas prices stay sidelined
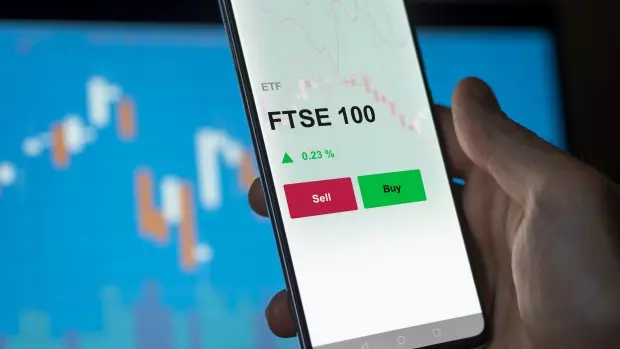
FTSE 100 hits record high as Wall Street stumbles on AI anxiety

Dow loses upside momentum as EUR/JPY stabilises and US natural gas volatility eases

FTSE 100 resumes ascent as silver price hits record high, USD/JPY stems sharp fall
You might be interested in…
Go long or short on over 13,000 share prices. Find out more about why you should choose IG.
Discover why so many clients choose us, and what makes us the world's No.1 provider of CFDs.1
Improve your trading skills by working through interactive courses on the IG Academy app.
1Based on revenue (published financial statements, August 2024)
