10 trading indicators every trader should know
Using trading indicators is part of any technical trader’s strategy. Paired with the right risk management tools, it could help you gain more insight into price trends. Let’s explore 10 of the best trading indicators.

Trading indicators explained
Whether you’re interested in forex trading, commodities trading or share trading, it can be helpful to use technical analysis as part of your strategy – and this includes studying various trading indicators. Trading indicators are mathematical calculations, which are plotted as lines on a price chart and can help traders identify certain signals and trends within the market.
There are different types of trading indicator, including leading indicators and lagging indicators. A leading indicator is a forecast signal that predicts future price movements, while a lagging indicator looks at past trends and indicates momentum.
Best trading indicators
- Moving average (MA)
- Exponential moving average (EMA)
- Stochastic oscillator
- Moving average convergence divergence (MACD)
- Bollinger bands
- Relative strength index (RSI)
- Fibonacci retracement
- Ichimoku cloud
- Standard deviation
- Average directional index
You can use your knowledge and risk appetite as a measure to decide which of these trading indicators best suit your strategy. Note that the indicators listed here are not ranked, but they are some of the most popular choices for retail traders.
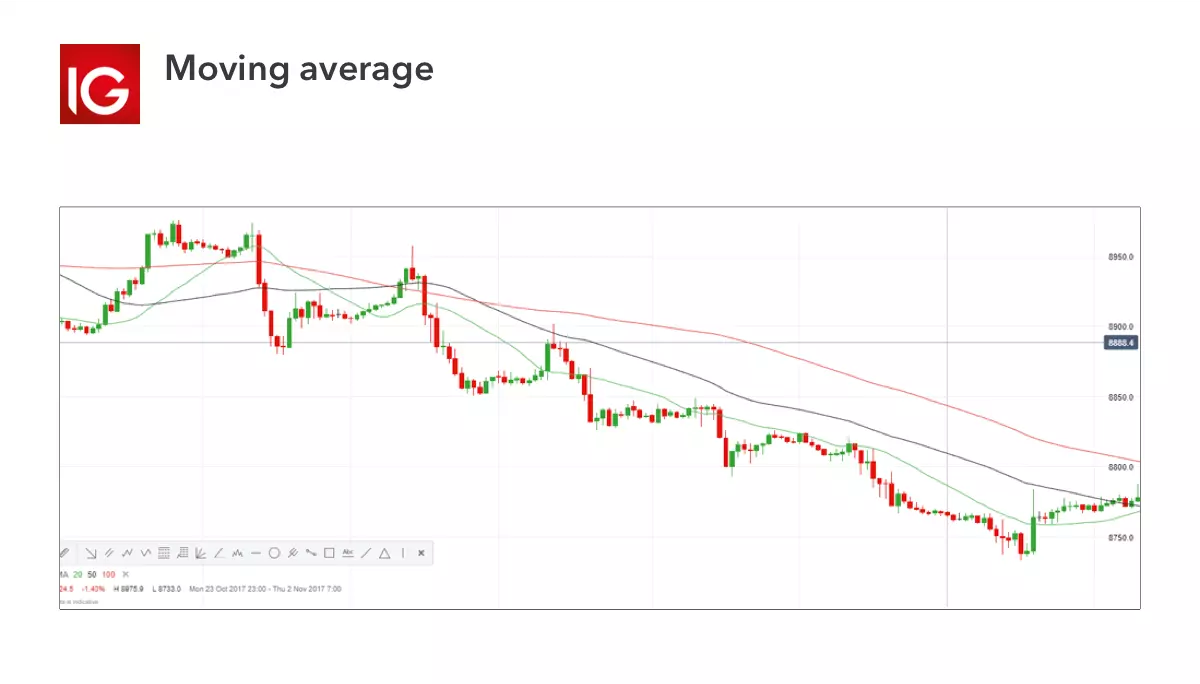
Moving average (MA)
The MA – or ‘simple moving average’ (SMA) – is an indicator used to identify the direction of a current price trend, without the interference of shorter-term price spikes. The MA indicator combines price points of a financial instrument over a specified time frame and divides it by the number of data points to present a single trend line.
The data used depends on the length of the MA. For example, a 200-day MA requires 200 days of data. By using the MA indicator, you can study levels of support and resistance and see previous price action (the history of the market). This means you can also determine possible future patterns.
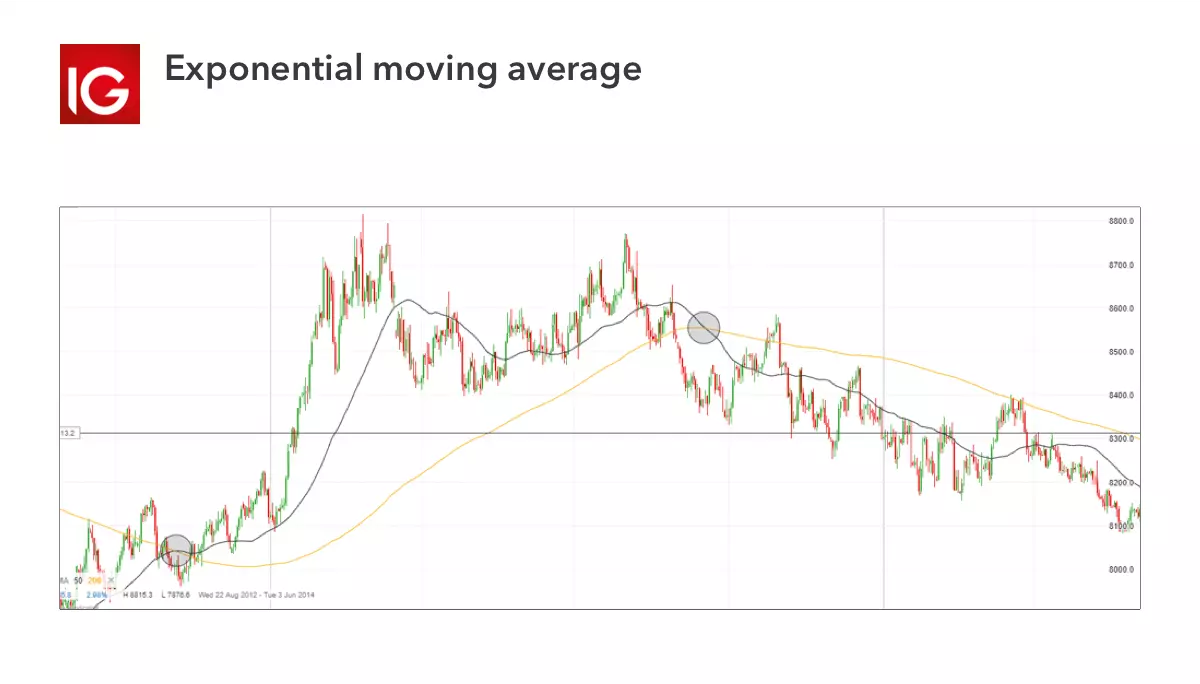
Exponential moving average (EMA)
EMA is another form of moving average. Unlike the SMA, it places a greater weight on recent data points, making data more responsive to new information. When used with other indicators, EMAs can help traders confirm significant market moves and gauge their legitimacy.
The most popular exponential moving averages are 12- and 26-day EMAs for short-term averages, whereas the 50- and 200-day EMAs are used as long-term trend indicators.
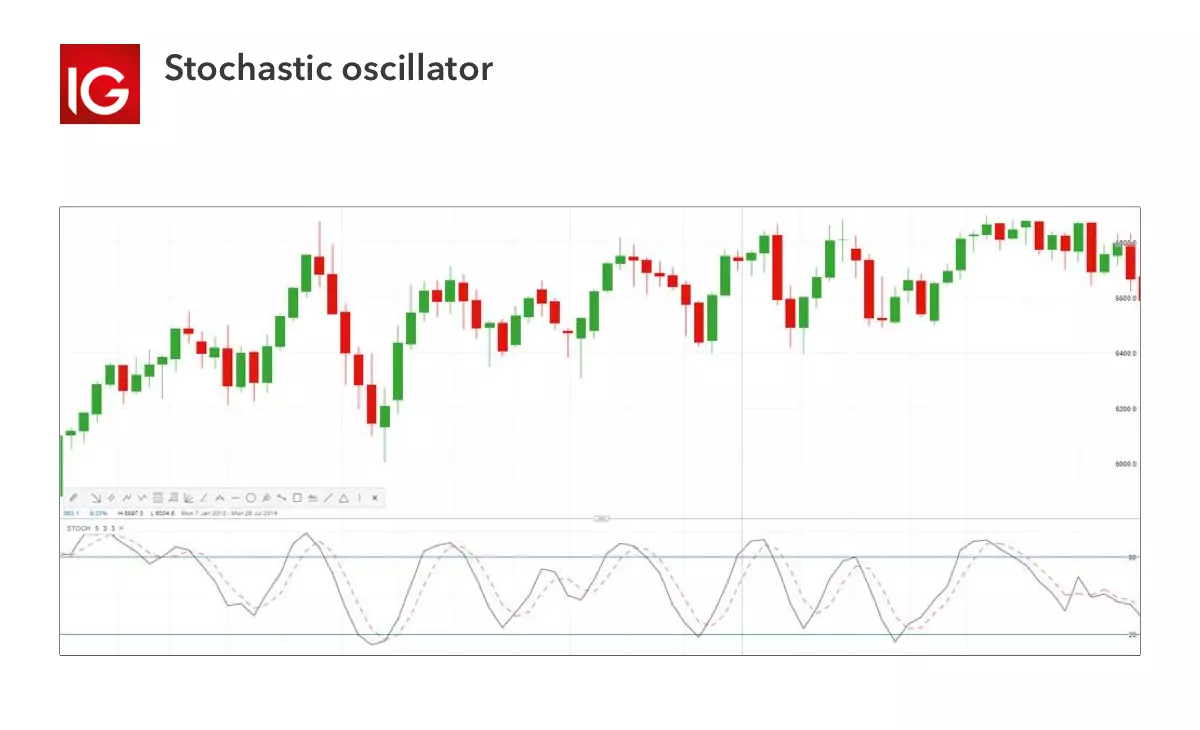
Stochastic oscillator
A stochastic oscillator is an indicator that compares a specific closing price of an asset to a range of its prices over time – showing momentum and trend strength. It uses a scale of 0 to 100. A reading below 20 generally represents an oversold market and a reading above 80 an overbought market. However, if a strong trend is present, a correction or rally will not necessarily ensue.
Moving average convergence divergence (MACD)
MACD is an indicator that detects changes in momentum by comparing two moving averages. It can help traders identify possible buy and sell opportunities around support and resistance levels.
‘Convergence’ means that two moving averages are coming together, while ‘divergence’ means that they’re moving away from each other. If moving averages are converging, it means momentum is decreasing, whereas if the moving averages are diverging, momentum is increasing.
.png/jcr:content/renditions/original-size.webp)
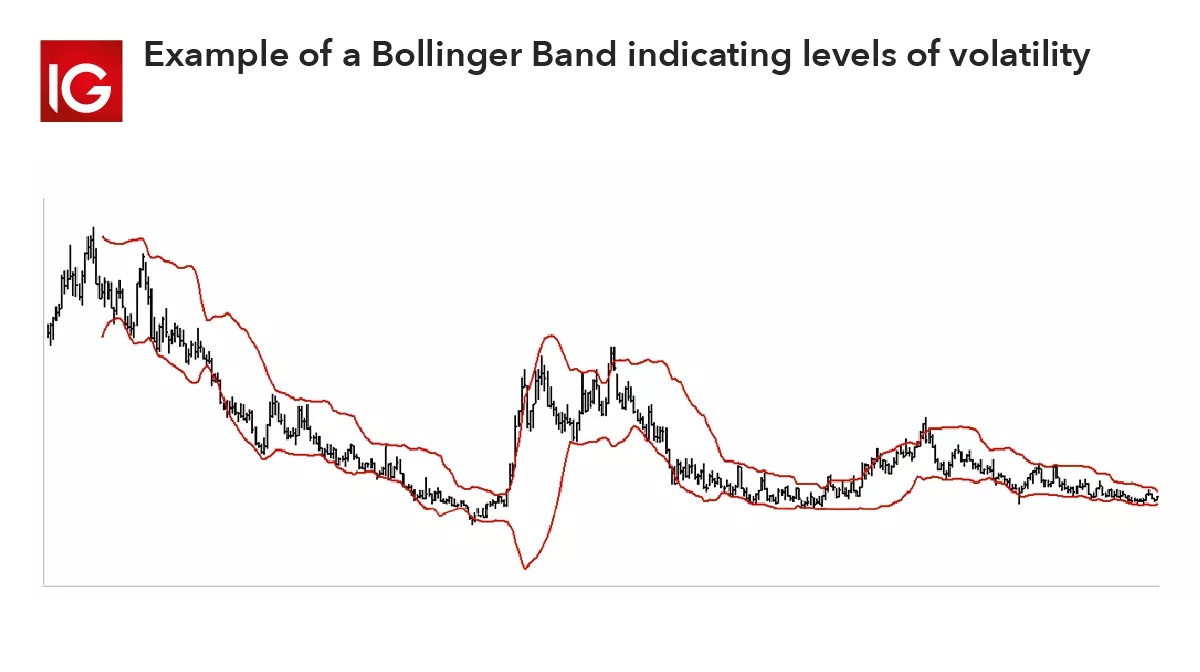
Bollinger bands
A Bollinger band is an indicator that provides a range within which the price of an asset typically trades. The width of the band increases and decreases to reflect recent volatility. The closer the bands are to each other – or the ‘narrower’ they are – the lower the perceived volatility of the financial instrument. The wider the bands, the higher the perceived volatility.
Bollinger bands are useful for recognising when an asset is trading outside of its usual levels, and are used mostly as a method to predict long-term price movements. When a price continually moves outside the upper parameters of the band, it could be overbought, and when it moves below the lower band, it could be oversold.
Relative strength index (RSI)
RSI is mostly used to help traders identify momentum, market conditions and warning signals for dangerous price movements. RSI is expressed as a figure between 0 and 100. An asset around the 70 level is often considered overbought, while an asset at or near 30 is often considered oversold.
An overbought signal suggests that short-term gains may be reaching a point of maturity and assets may be in for a price correction. In contrast, an oversold signal could mean that short-term declines are reaching maturity and assets may be in for a rally.
.png/jcr:content/renditions/original-size.webp)
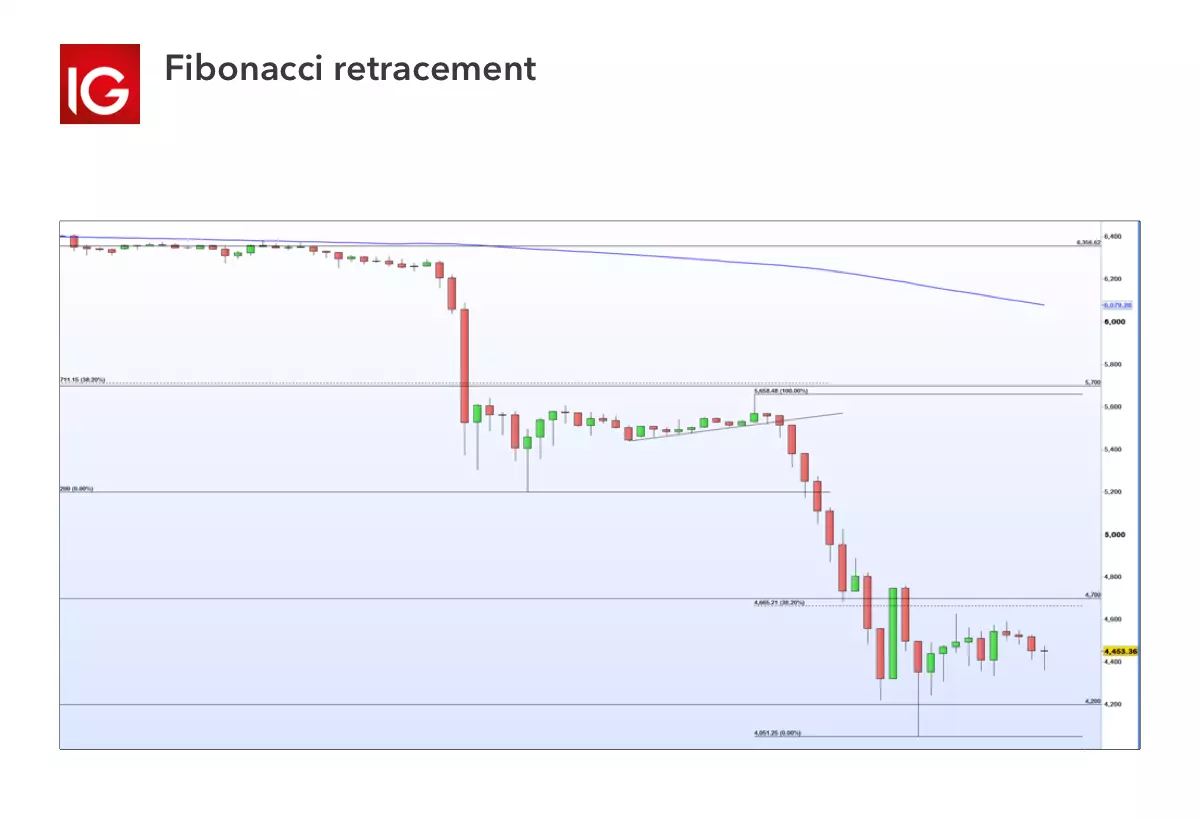
Fibonacci retracement
Fibonacci retracement is an indicator that can pinpoint the degree to which a market will move against its current trend. A retracement is when the market experiences a temporary dip – it is also known as a pullback.
Traders who think the market is about to make a move often use Fibonacci retracement to confirm this. This is because it helps to identify possible levels of support and resistance, which could indicate an upward or downward trend. Because traders can identify levels of support and resistance with this indicator, it can help them decide where to apply stops and limits, or when to open and close their positions.
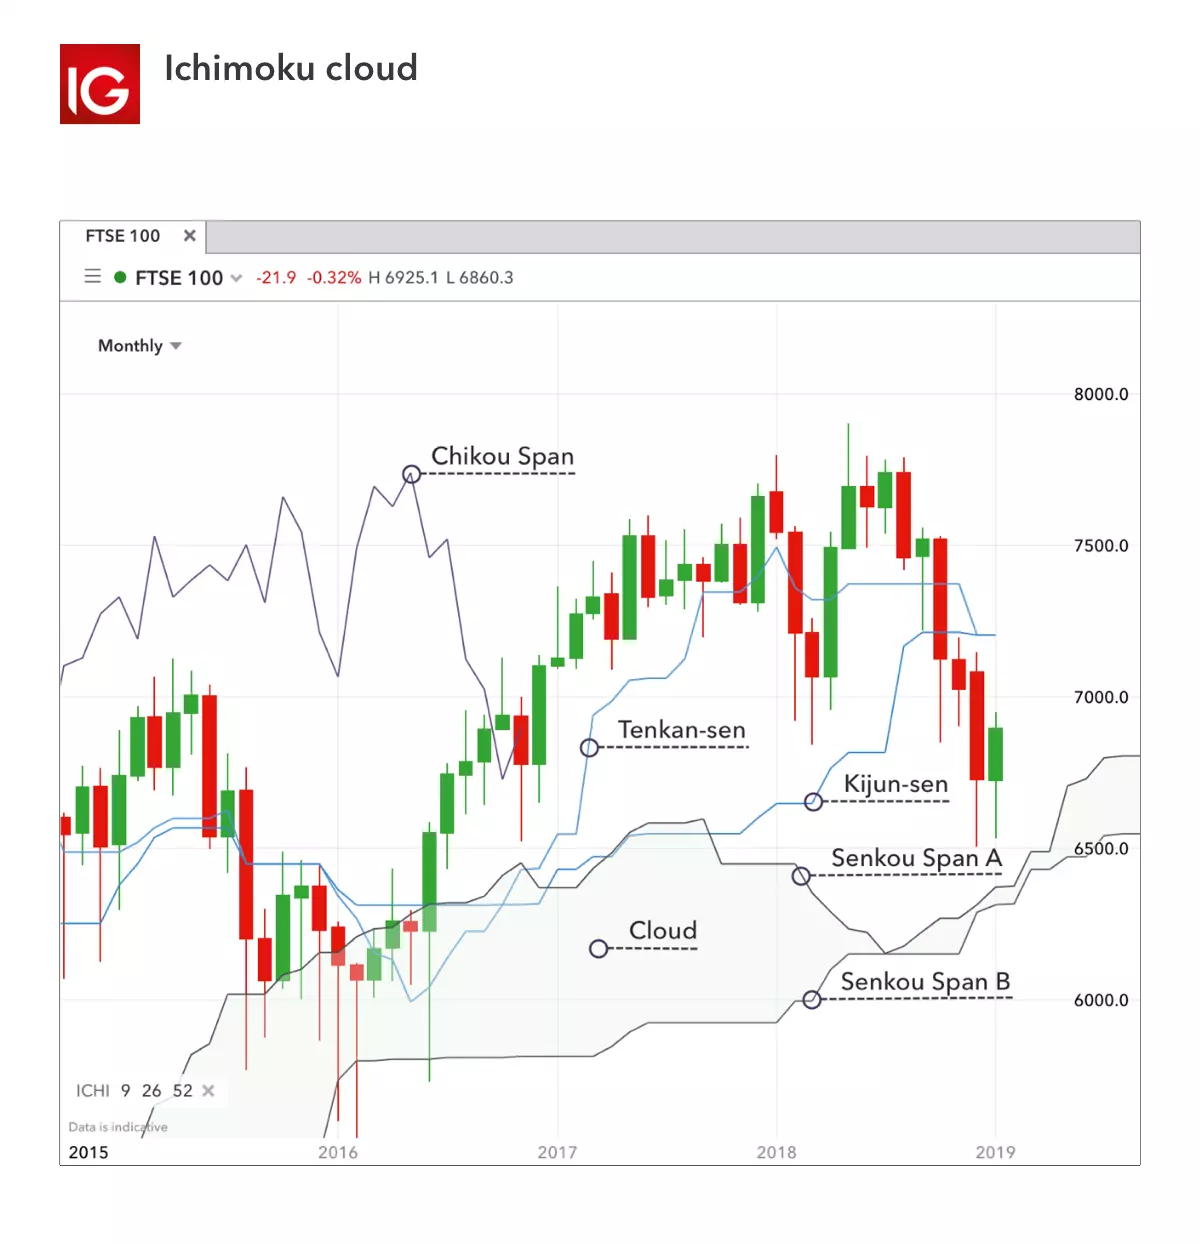
Ichimoku cloud
The Ichimoku Cloud, like many other technical indicators, identifies support and resistance levels. However, it also estimates price momentum and provides traders with signals to help them with their decision-making. The translation of ‘Ichimoku’ is ‘one-look equilibrium chart’ – which is exactly why this indicator is used by traders who need a lot of information from one chart.
In a nutshell, it identifies market trends, showing current support and resistance levels, and also forecasting future levels.
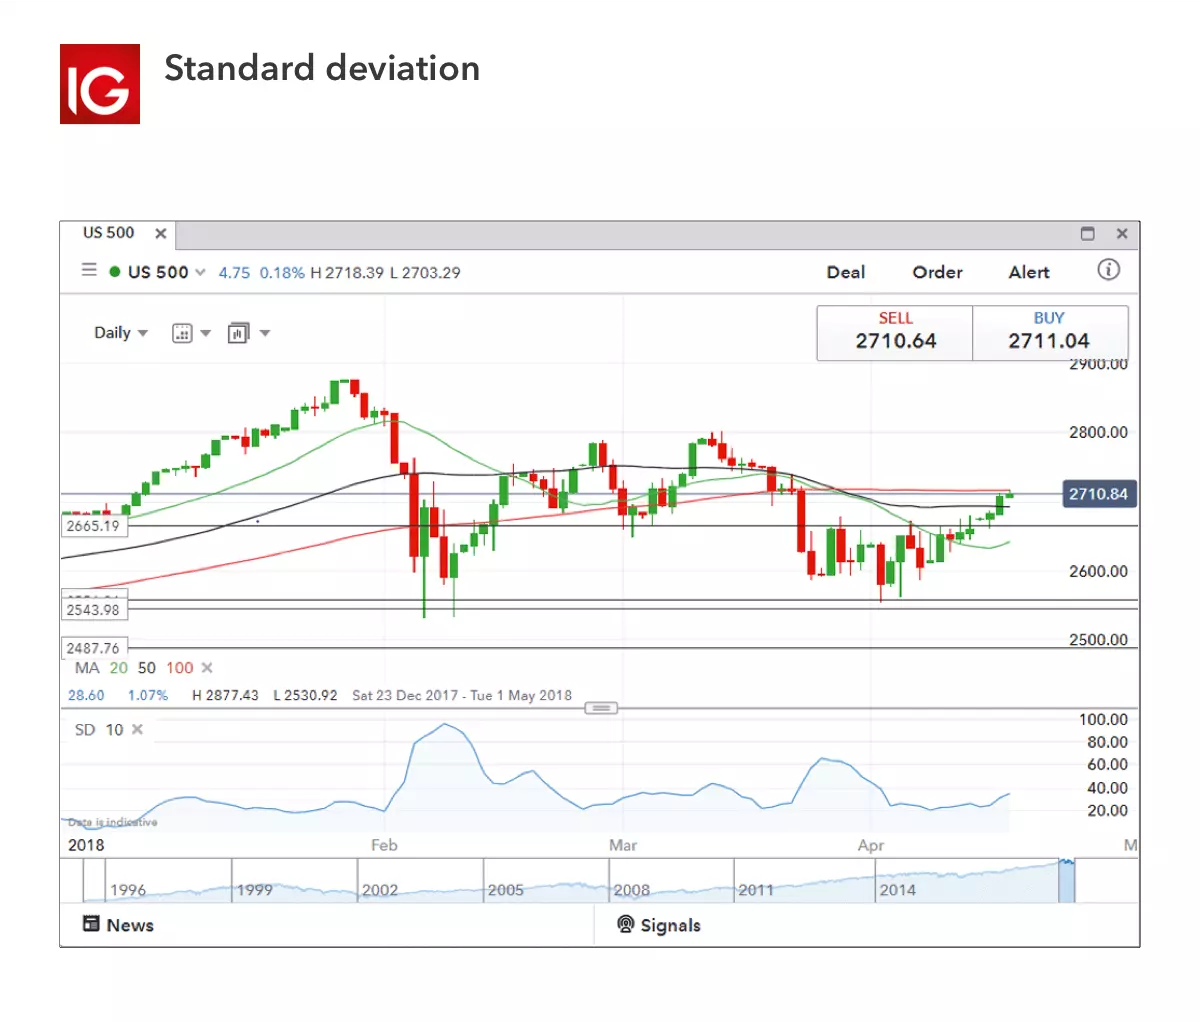
Standard deviation
Standard deviation is an indicator that helps traders measure the size of price moves. Consequently, they can identify how likely volatility is to affect the price in the future. It cannot predict whether the price will go up or down, only that it will be affected by volatility.
Standard deviation compares current price movements to historical price movements. Many traders believe that big price moves follow small price moves, and small price moves follow big price moves.
Read more about standard deviation here
Average directional index (ADX)
The ADX illustrates the strength of a price trend. It works on a scale of 0 to 100, where a reading of more than 25 is considered a strong trend, and a number below 25 is considered a drift. Traders can use this information to gather whether an upward or downward trend is likely to continue.
ADX is normally based on a moving average of the price range over 14 days, depending on the frequency that traders prefer. Note that ADX never shows how a price trend might develop, it simply indicates the strength of the trend. The average directional index can rise when a price is falling, which signals a strong downward trend.
.png/jcr:content/renditions/original-size.webp)
What you need to know before using trading indicators
The first rule of using trading indicators is that you should never use an indicator in isolation or use too many indicators at once. Focus on a few that you think are best suited to what you’re trying to achieve. You should also use technical indicators alongside your own assessment of the movements of an asset’s price over time (the ‘price action’).
It’s important to remember that you have to confirm a signal in some way. If you’re getting a ‘buy’ signal from an indicator and a ‘sell’ signal from the price action, you need to use different indicators, or different time frames until your signals are confirmed.
Another thing to keep in mind is that you must never lose sight of your trading plan. Your rules for trading should always be implemented when using indicators.
To practise using trading indicators, try IG’s demo account.
Or, if you’re ready to start trading, open a live account.
This information has been prepared by IG, a trading name of IG Markets Limited. In addition to the disclaimer below, the material on this page does not contain a record of our trading prices, or an offer of, or solicitation for, a transaction in any financial instrument. IG accepts no responsibility for any use that may be made of these comments and for any consequences that result. No representation or warranty is given as to the accuracy or completeness of this information. Consequently any person acting on it does so entirely at their own risk. Any research provided does not have regard to the specific investment objectives, financial situation and needs of any specific person who may receive it. It has not been prepared in accordance with legal requirements designed to promote the independence of investment research and as such is considered to be a marketing communication. Although we are not specifically constrained from dealing ahead of our recommendations we do not seek to take advantage of them before they are provided to our clients.

Explore the markets with our free course
Discover the range of markets and learn how they work - with IG Academy's online course.
