Nasdaq: Suffers worst day since 2022
Technical overview shifted prior on the daily time frame, and now both IG clients and CoT speculators are majority to the buy side.


Big Tech rout means tech-heavy Nasdaq suffers most among key equity indices
It was about processing earnings from a couple of Big Tech that released their figures last Tuesday: Tesla’s share price down over 12% after its earnings and profit margin miss, and to a lesser extent Alphabet down 5% following its miss on YouTube ad revenue. Sector performance by the close put tech, consumer discretionary and communication in the very bottom with significant declines and meant a bruising session for the tech-heavy Nasdaq, and even small caps that have been in focus as of late given their outperformance couldn’t avoid losses after consecutive gains with the Russell 2000 ending in the red, and so too the S&P MidCap 400. 31% of the S&P 500 companies have reported earnings so far, and 78% of them have bested forecasts (LSEG), but it’s more about Big Tech justifying their big valuations given they’ve been responsible for most of the gains that took the notable equity indices to record highs.
US data mostly disappoints
As for economic data out of the US, it was a mixed story for preliminary PMIs (Purchasing Managers’ Index) out of S&P Global, manufacturing falling back into contraction with a surprise 49.5 print while services remained in expansionary territory and improved to 56. Those following the housing sector, new home sales in June fell 0.6% month-on-month and the weekly mortgage applications out of MBA was down 2.2%.
Upcoming data: Advance GDP, PCE price index, durables
There’s more data on offer with advance GDP (Gross Domestic Product) for the second quarter releasing today, durables for the month of June, pending home sale for the same month, and the weekly claims. It’s expected to be more impacting and more interesting with PCE (Personal Consumption Expenditures) price index tomorrow for the month of June, this prior to next week’s FOMC (Federal Open Market Committee) meeting, and where more (and larger) tech heavyweights will be reporting.
Nasdaq 100 Technical analysis, overview, strategies, and levels
Conflicting technical overviews depending on which time frame you’re looking at, with the weekly still ‘bull average’ needing further pullback and working with a far larger channel. But zooming into the daily time frame and a couple of its key technical indicators have turned negative with much of the remainder neutral, and in turn a shift from ‘bull average’ to ‘consolidation – volatile’ last Tuesday where breakouts have net outperformed and buys got tested, though at times has required interday follow-through the likes of which occurred yesterday. Expect more intraday volatility with what’s on offer on the fundamental front both this week and next in what will likely be a test for narrower daily price levels.

IG client* and CoT** sentiment for the Nasdaq 100
IG clients shorted heavily into price gains when the tech-heavy index reached record highs earlier this month, and there’s been a significant unwind in that sell bias when the pullback in price started, shifting the bias among them from majority sell to majority buy, and as of this morning reaching heavy long territory at 65%.
As for CoT speculators, they’re still in slight buy territory with the story generally one of caution buying into price gains prior, though the latest report shows a drop from 53% to 52% on a larger reduction in longs (by 1,784 lots) over shorts (by 352).

Nasdaq 100 chart with retail and institutional sentiment

*The percentage of IG client accounts with positions in this market that are currently long or short. Calculated to the nearest 1%, as of today morning 8am for the outer circle. Inner circle is from the previous trading day.
**CoT sentiment taken from the CFTC’s Commitment of Traders report, outer circle is latest report released on Friday with the positions as of last Tuesday, inner circle from the report prior.
This information has been prepared by IG, a trading name of IG Limited. In addition to the disclaimer below, the material on this page does not contain a record of our trading prices, or an offer of, or solicitation for, a transaction in any financial instrument. IG accepts no responsibility for any use that may be made of these comments and for any consequences that result. No representation or warranty is given as to the accuracy or completeness of this information. Consequently any person acting on it does so entirely at their own risk. Any research provided does not have regard to the specific investment objectives, financial situation and needs of any specific person who may receive it. It has not been prepared in accordance with legal requirements designed to promote the independence of investment research and as such is considered to be a marketing communication. Although we are not specifically constrained from dealing ahead of our recommendations we do not seek to take advantage of them before they are provided to our clients.
CFDs are a leveraged products. CFD trading may not be suitable for everyone and can result in losses that exceed your initial deposit, so please ensure that you fully understand the risks involved.
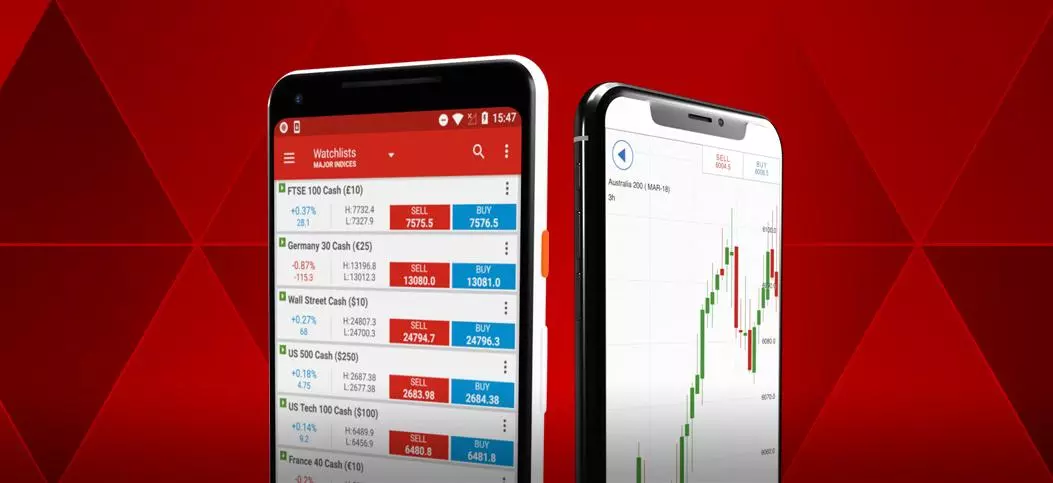
See an opportunity to trade?
Go long or short on more than 17,000 markets with IG.
Trade CFDs on our award-winning platform, with low spreads on indices, shares, commodities and more.
Live prices on most popular markets
- Forex
- Shares
- Indices
Prices above are subject to our website terms and agreements. Prices are indicative only. All shares prices are delayed by at least 15 mins.

