Oil drops on Saudi price cuts, gold and silver prices also under pressure
Outlook on Brent crude oil, gold and silver as Saudi Arabia reduces February official selling price for Asia.


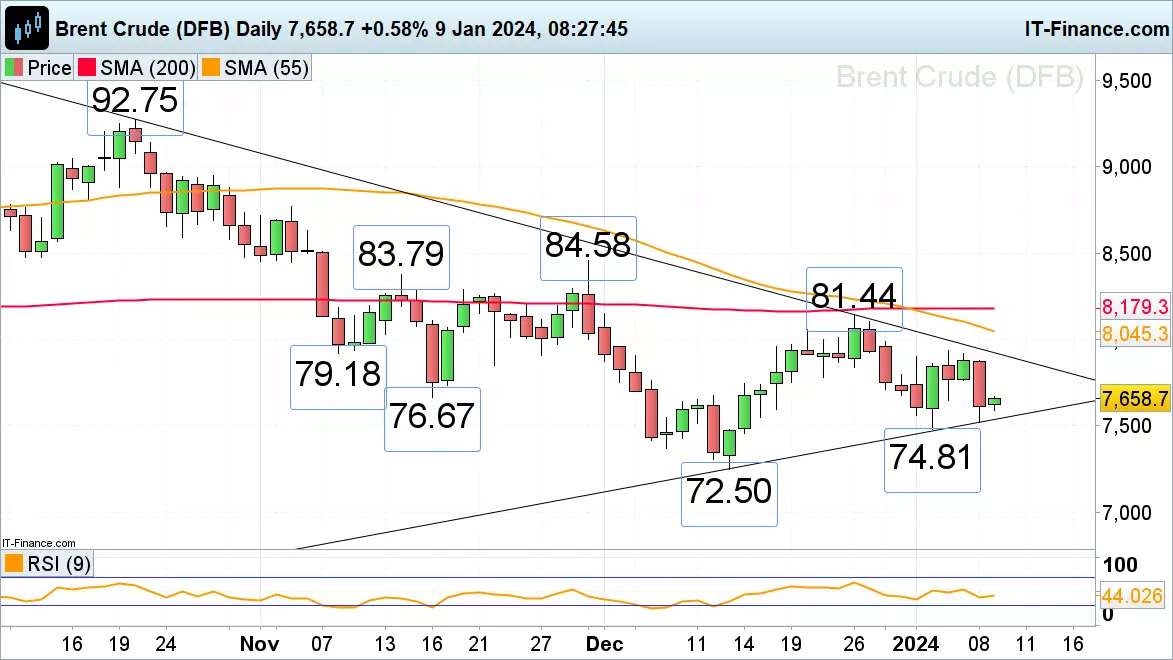
Brent crude oil takes hit on Saudi price cuts
Oil - Brent Crude fell by over 3% on Monday as Saudi Arabia announced a reduction in the February official selling price (OSP) of its primary Arab Light crude oil for Asia by $2 to $1.50 a barrel above the benchmark, its lowest level in 27 months. It did so amid increasing global supply, especially from non-OPEC producers, and dwindling demand.
The front month futures contract held above last week’s 74.81 low, though. Were it to give way, the 7 December low at 73.69 would likely represent the next downside target ahead of the 72.50 December low.
Resistance can now be spotted around Friday’s 77.60 low ahead of the October-to-January downtrend line at 79.22 and last week’s 79.35 high.
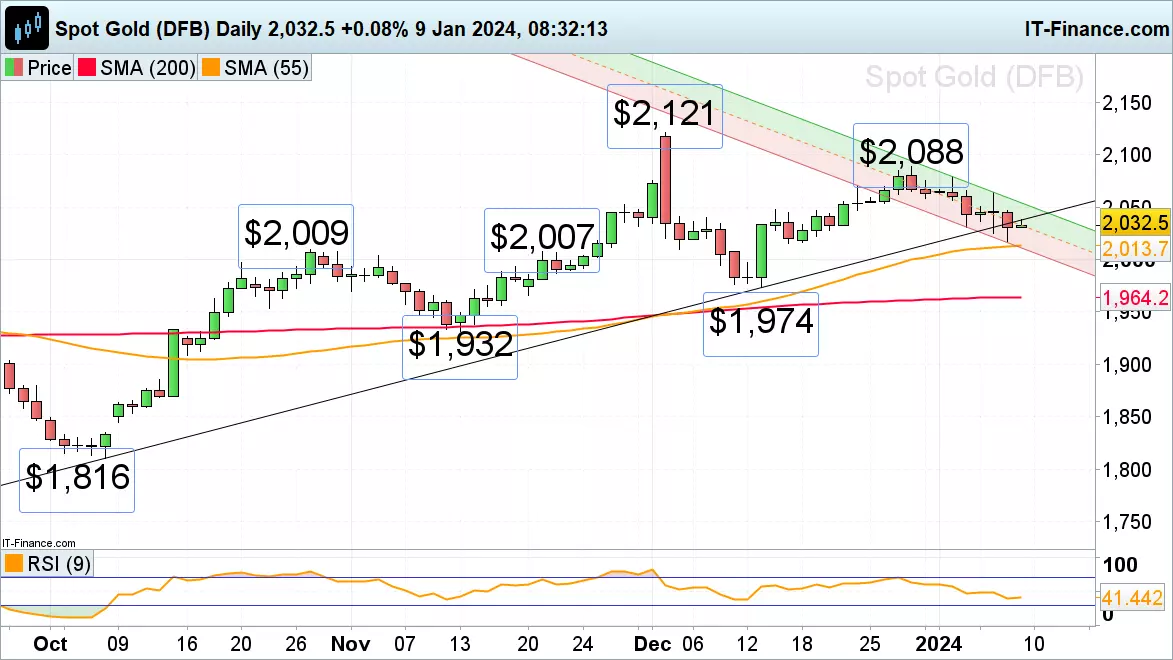
Gold price continues to slide
Spot Gold’s drop from its $2,088 per troy ounce late December high amid an appreciating US dollar has so far taken it to Monday’s $2,017 low from where it is trying to recover. Slightly further down support can be found along the 55-day simple moving average (SMA) at $2,014 and, more significantly, between the October and late November highs at $2,009 to $2,007.
Resistance above the breached October-to-January uptrend line, now because of inverse polarity a resistance line, at $2,038 can be spotted at Friday’s $2,064 high. While remaining below it, downside pressure should retain the upper hand.
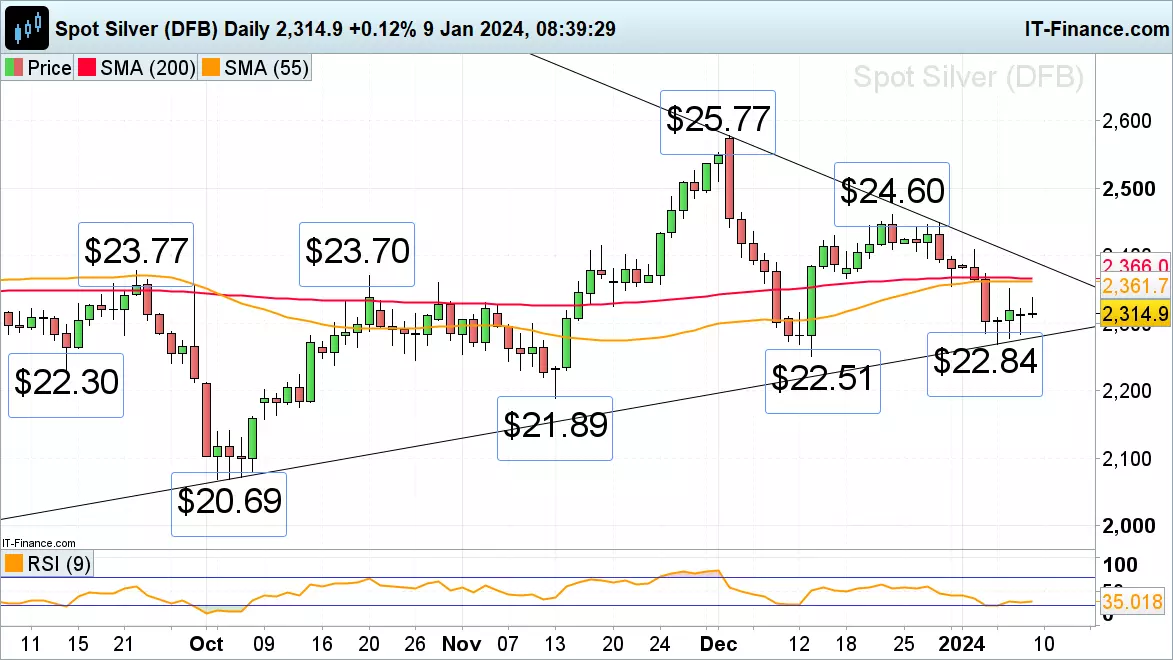
Silver price hovers above support
Spot Silver (5000oz)’s descent from its late December per troy ounce high at $24.60 on the back of an appreciating US dollar took it to last week’s $22.84 low, above which it has been hovering since. Slightly below it remains the $22.51 December low which should act as support, were it to be retested. Further down sits the November low at $21.89.
Minor resistance above Tuesday’s $23.37 intraday high can be seen between Friday’s high and the 55- and 200-day simple moving averages (SMA) at $23.51 to $23.66. While this resistance area caps, downside pressure should continue to dominate.
This information has been prepared by IG, a trading name of IG Limited. In addition to the disclaimer below, the material on this page does not contain a record of our trading prices, or an offer of, or solicitation for, a transaction in any financial instrument. IG accepts no responsibility for any use that may be made of these comments and for any consequences that result. No representation or warranty is given as to the accuracy or completeness of this information. Consequently any person acting on it does so entirely at their own risk. Any research provided does not have regard to the specific investment objectives, financial situation and needs of any specific person who may receive it. It has not been prepared in accordance with legal requirements designed to promote the independence of investment research and as such is considered to be a marketing communication. Although we are not specifically constrained from dealing ahead of our recommendations we do not seek to take advantage of them before they are provided to our clients.
CFDs are a leveraged products. CFD trading may not be suitable for everyone and can result in losses that exceed your initial deposit, so please ensure that you fully understand the risks involved.

Start trading forex today
Find opportunity on the world’s most-traded – and most-volatile – financial market
- Trade spreads from just 0.6 points on EUR/USD
- Analyse with clear, fast charts
- Speculate wherever you are with our intuitive mobile apps
See an FX opportunity?
Try a risk-free trade in your demo account, and see whether you’re onto something.
- Log in to your demo
- Try a risk-free trade
- See whether your hunch pays off
See an FX opportunity?
Don’t miss your chance – upgrade to a live account to take advantage.
- Get spreads from just 0.6 points on popular pairs
- Analyse and deal seamlessly on fast, intuitive charts
- See and react to breaking news in-platform
See an FX opportunity?
Don’t miss your chance. Log in to take your position.
Live prices on most popular markets
- Forex
- Shares
- Indices
Prices above are subject to our website terms and agreements. Prices are indicative only. All shares prices are delayed by at least 15 mins.

