Uber’s share price: what to expect from Q2 results
Find out what to expect from Uber’s earnings results, how they will affect Uber share price, and how to trade Uber’s earnings.


Uber share price: forecasts from Q2 results
But unlike the FAANG stocks, profitability has always been an issue when it comes to the ridesharing companies, even if Uber is aiming to achieve profitability by year end, on an adjusted earnings before interest, taxes, depreciation and amortisation (EBITDA) basis. Its optimism regarding achieving that goal might have to wait a bit longer, testing investors who had they purchased its shares at the start of the year would be in loss.
Expectations last time around in Q1 were for an earnings per share (EPS) reading of -$0.54 (source: finance.yahoo.com), and the clear beat of -$0.06 last time around was noted while revenue was a miss. The issue was that the much smaller Q1 loss of $108 million instead of the near billion dollar loss in Q4 2020 was due to the $1.6 billion gain from the sale of its self-driving unit for $1.6 billion, something it can’t repeat this time around.
And when it comes to Q2, estimates are pointing to another quarter of losses with an EPS of -$0.51. Analysts are mostly holding a buy rating with a handful in the hold and a tiny minority in the sell category, for a clear majority long bias that’s been tested on the latest share price moves. Their average Uber share price target is also higher than where its share price currently resides, and above the lower end of the target. It’s a somewhat familiar story for its competitor Lyft, but where more have a hold recommendation and with an average price target (of over $69) similar to Uber, only with a higher current Lyft share price means there’s less upside potential towards reaching that target.
There have been a few factors to consider for future earnings and/or its share price:
- Reports according to Consumer news and business channel (CNBC) that SoftBank plans to sell one-third of its Uber shares to cover losses in ride-hailing DiDi sending share prices lower
- Uber’s trucking division to purchase Transplace in a $2.25 billion deal using $750 million worth of common stock of Uber, and the remainder in cash
- September’s expected end to enhanced unemployment benefits crucial to see how it’ll change the return of workers who might otherwise be disincentivised with demand currently for drivers above supply translating into longer wait times and higher prices
- There’s also car prices and semiconductor shortages making any conversion to ridesharing pricier than pre-Covid-19 costs.
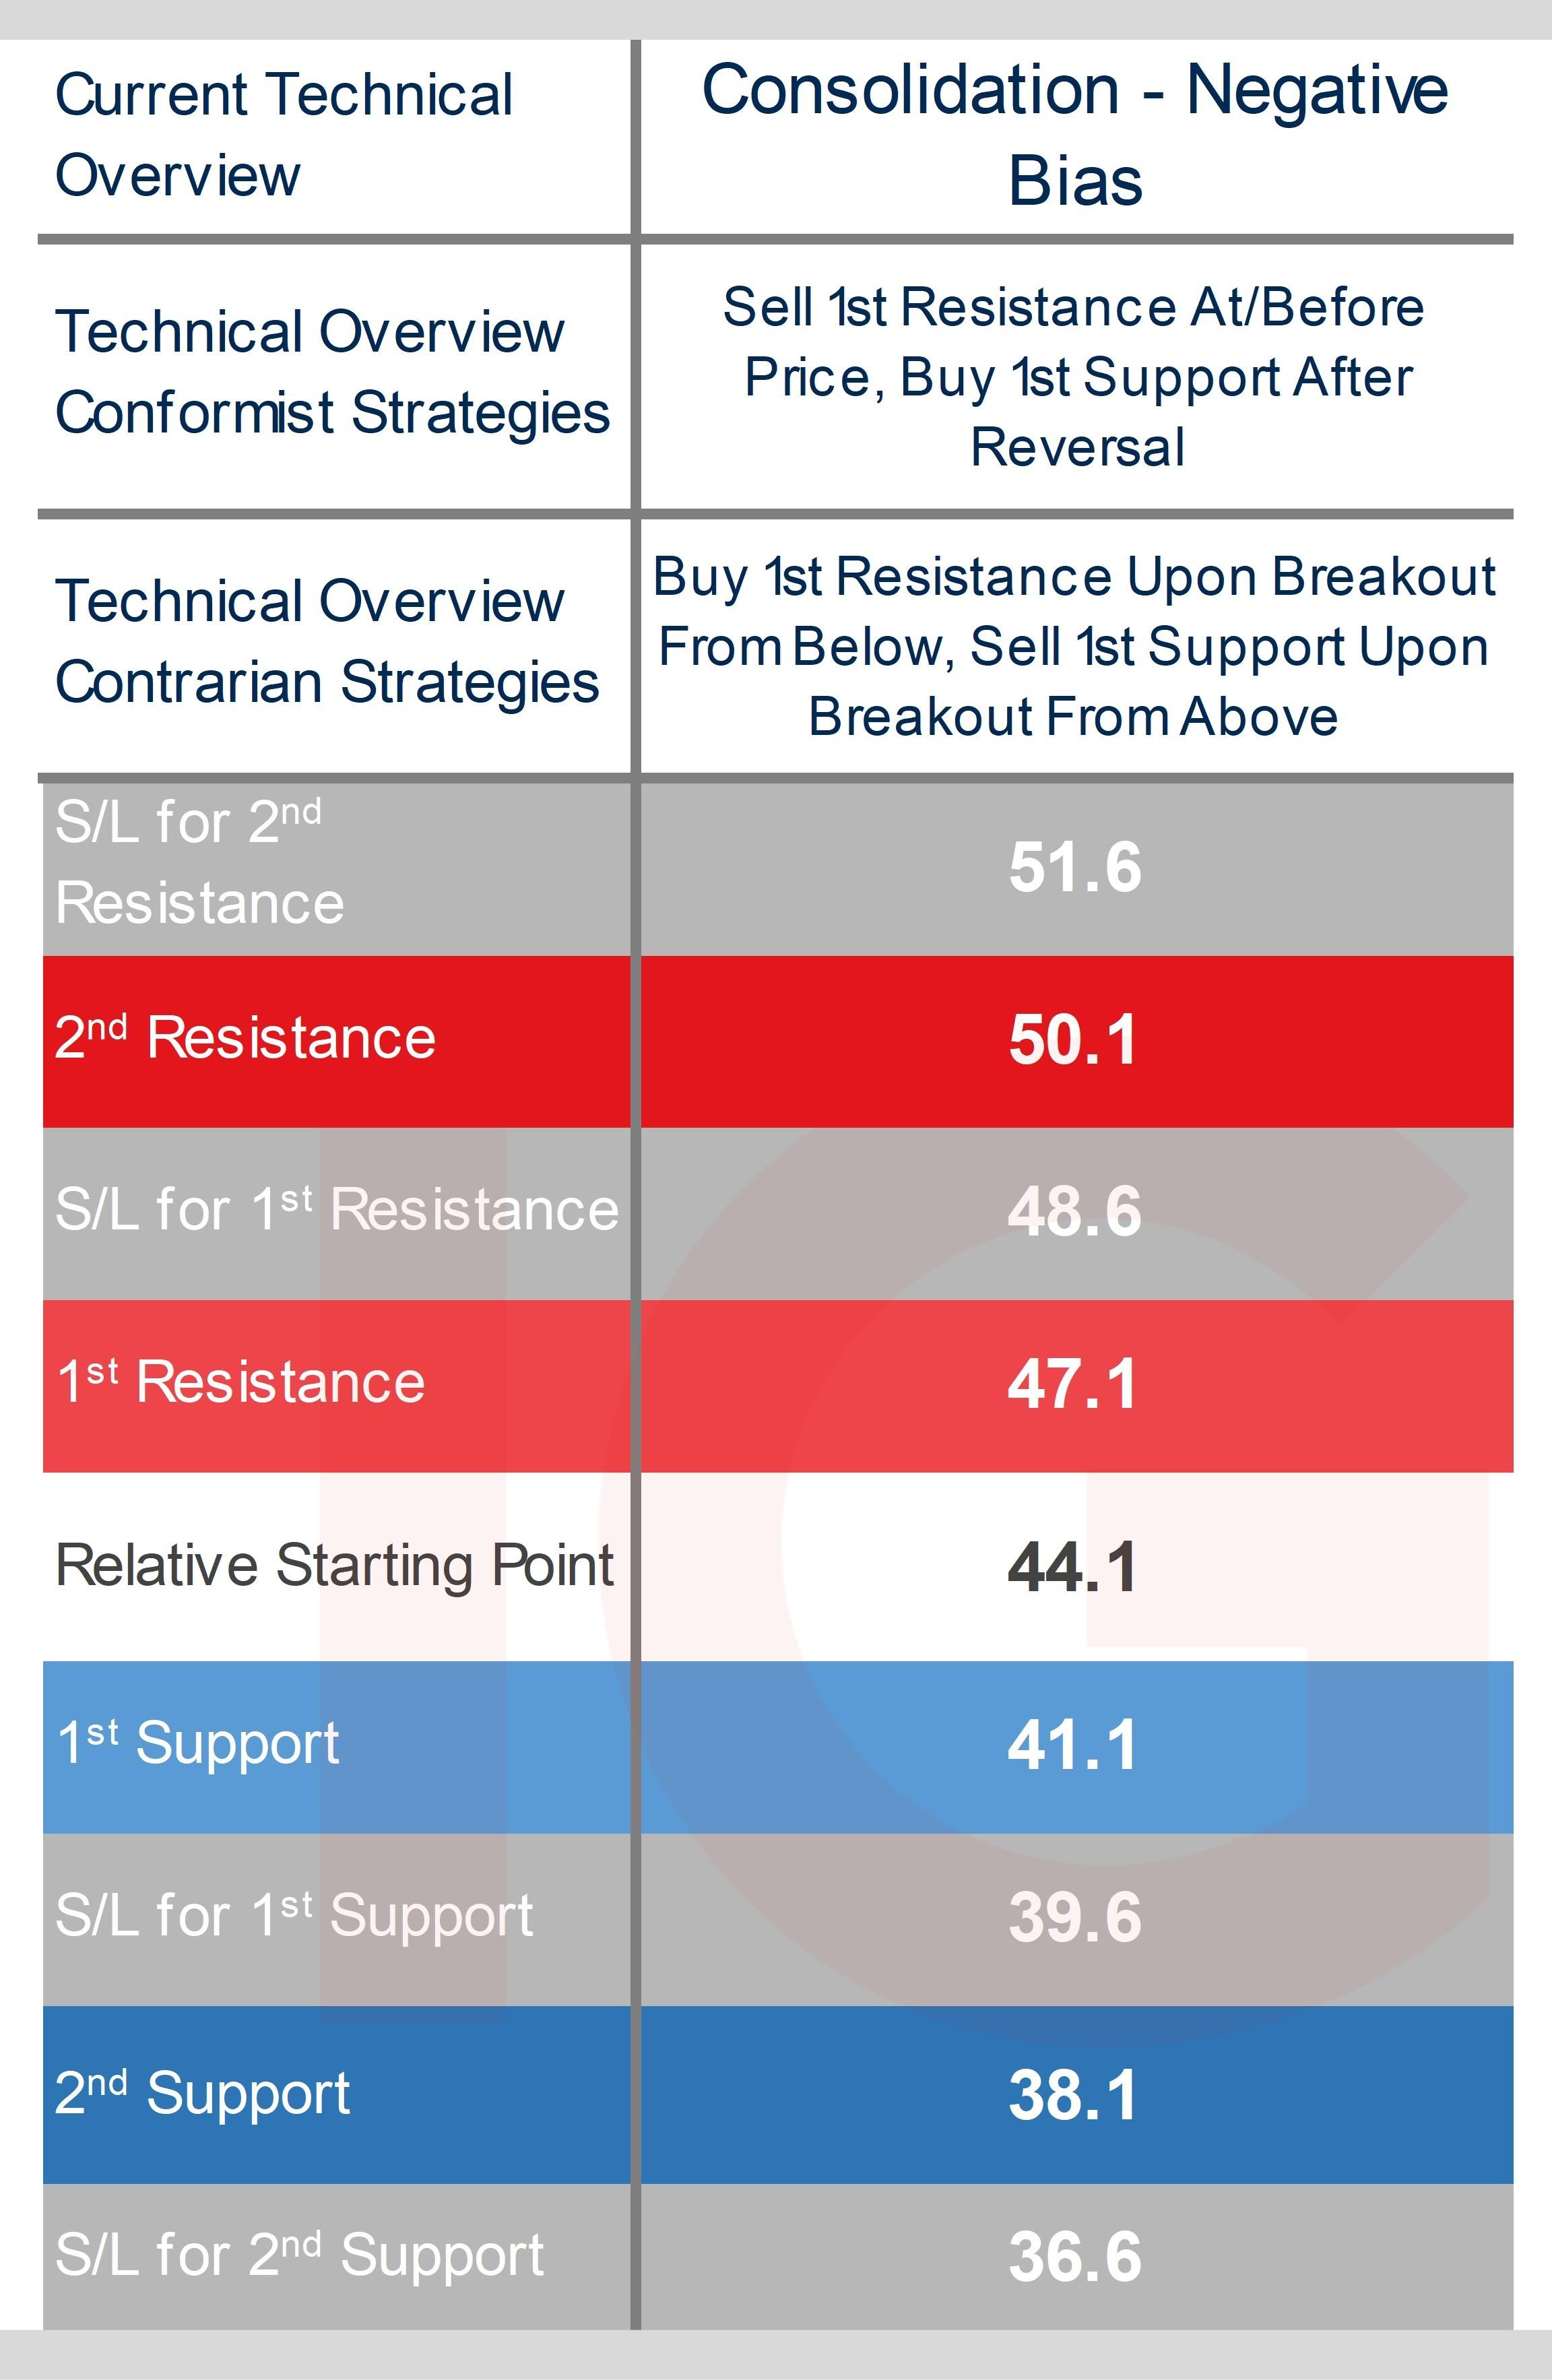
Trading Uber’s Q2 results: technical overview and trading strategies
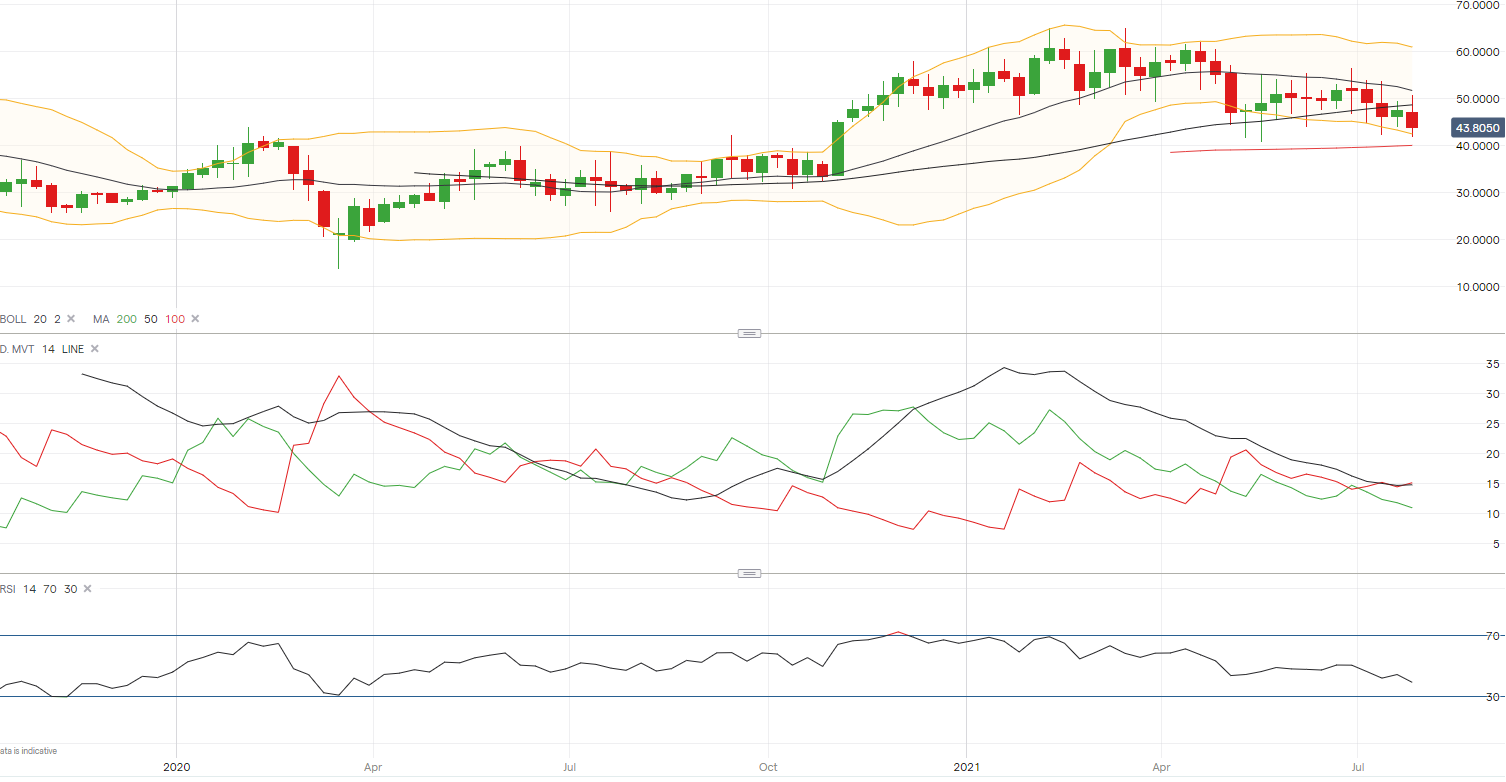
The technicals haven’t been too kind when it comes to Uber’s share price, spending much of it within the $40 to $54 ranges over the past few months or so in what would be described as a consolidatory technical overview, its price beneath most of its key long-term weekly moving averages (MA), a non-trending average directional movement index (ADX), directional movement index (DMI) crosses that have failed to offer much follow-through, and prices at the lower end of the Bollinger Bands that thus far has largely held. Prices that are close to key technical indicators who in turn are close to each other usually means plenty of false signals, and we’ve been getting plenty of that here. A similar picture is seen on the daily chart, where more negative technical bias is present, a negative DMI cross occurring last week and its relative strength index (RSI) crossing into oversold territory.
Conformist strategies befitting its consolidatory technical overview involves reversal strategies off of its key support and resistance levels, waiting for levels to breach first to avoid getting stopped out on the initial move, especially if volatility should pick up. Those expecting the fundamentals to push prices to a new zone and a shift in its current technical overview can consider breakout strategies, opting to buy at the 1st resistance or sell on a break of the 1st support level for a move towards 2nd levels or beyond.
Uber weekly chart with ADX, DMI, RSI and MA
IG client sentiment* and short interest for Uber shares
When it comes to retail sentiment, like with nearly all the main tech stocks, it has been a consistent extreme buy bias, and for Uber shares unchanged since the start of last week at 91%. Clear beneficiaries on gains in its share price above where it was at the start of the pandemic, but fresh buys stuck on the pullback from the $65 level witnessed in the first quarter.
As for short interest data (according to shortsqueeze.com), 4.6% of floated shares are shorted, for a total of about 70 million, down 6% from a previous 74.6 million shares shorted. It has risen since the last quarter when we did the Uber and Lyft earnings preview, as it was 65 million for the former putting short interest at a lower 4%. A similar story for its competitor Lyft, short interest rising from nearly 10% at the start of May to nearly 11%.
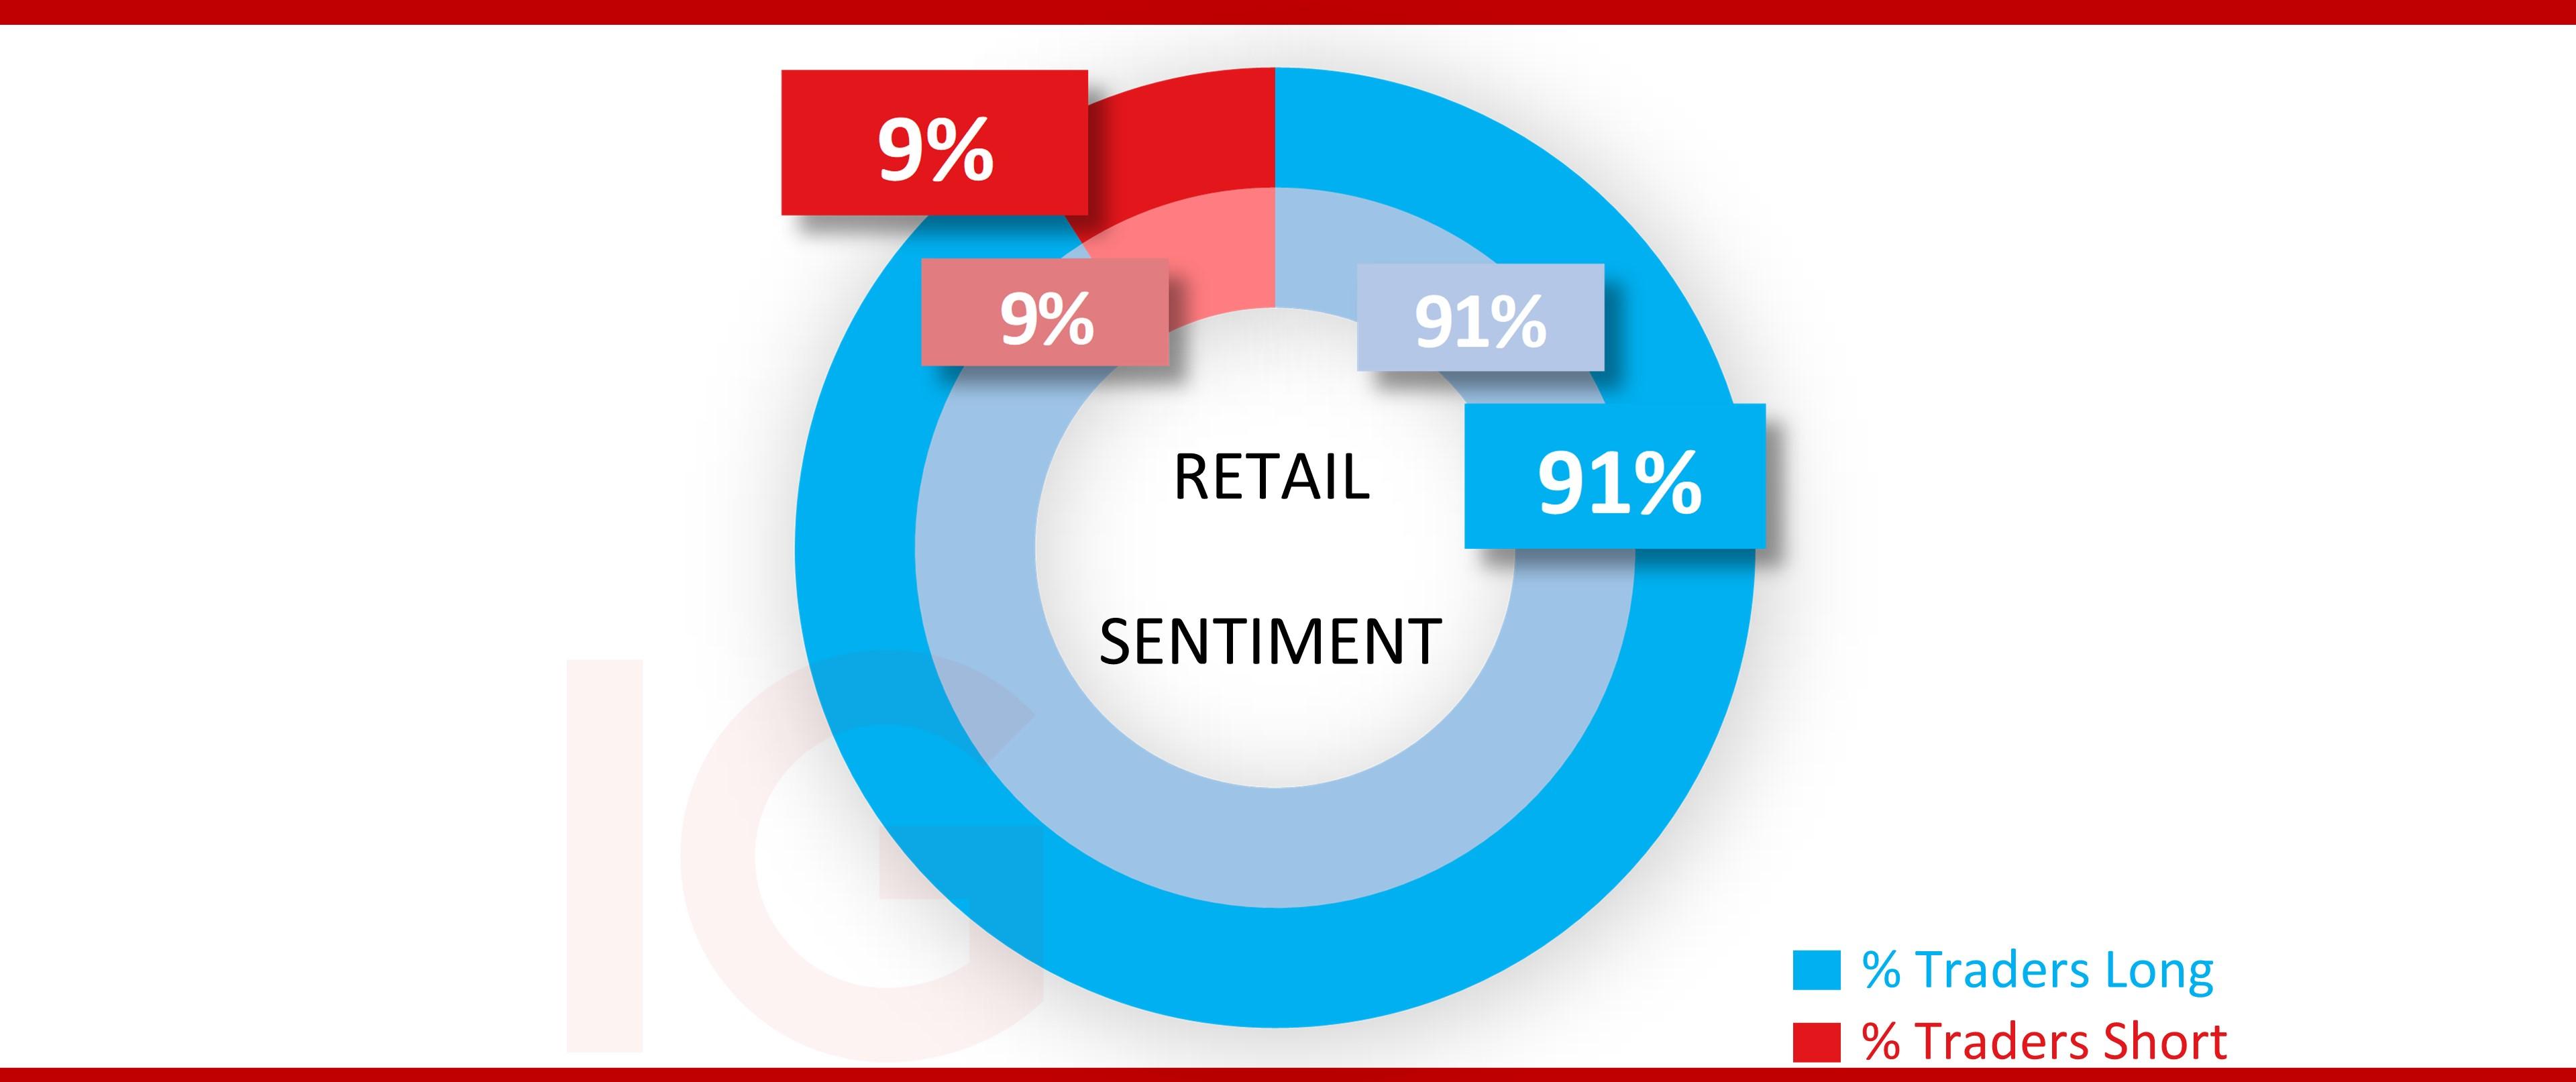
*The percentage of IG client accounts with positions in this market that are currently long or short. Calculated to the nearest 1%, as of today morning 8am for the outer circle. Inner circle is from the previous trading day.
IGA, may distribute information/research produced by its respective foreign affiliates within the IG Group of companies pursuant to an arrangement under Regulation 32C of the Financial Advisers Regulations. Where the research is distributed in Singapore to a person who is not an Accredited Investor, Expert Investor or an Institutional Investor, IGA accepts legal responsibility for the contents of the report to such persons only to the extent required by law. Singapore recipients should contact IGA at 6390 5118 for matters arising from, or in connection with the information distributed.
The information/research herein is prepared by IG Asia Pte Ltd (IGA) and its foreign affiliated companies (collectively known as the IG Group) and is intended for general circulation only. It does not take into account the specific investment objectives, financial situation, or particular needs of any particular person. You should take into account your specific investment objectives, financial situation, and particular needs before making a commitment to trade, including seeking advice from an independent financial adviser regarding the suitability of the investment, under a separate engagement, as you deem fit.
No representation or warranty is given as to the accuracy or completeness of this information. Consequently, any person acting on it does so entirely at their own risk. Please see important Research Disclaimer.
Please also note that the information does not contain a record of our trading prices, or an offer of, or solicitation for, a transaction in any financial instrument. Any views and opinions expressed may be changed without an update.

Seize a share opportunity today
Go long or short on thousands of international stocks.
- Increase your market exposure with leverage
- Get spreads from just 0.1% on major global shares
- Trade CFDs straight into order books with direct market access
Live prices on most popular markets
- Forex
- Shares
- Indices
See more forex live prices
See more shares live prices
Prices above are subject to our website terms and agreements. Prices are indicative only. All shares prices are delayed by at least 15 mins.
See more indices live prices
Prices above are subject to our website terms and agreements. Prices are indicative only. All shares prices are delayed by at least 20 mins.
