Anglo American share price: what to expect from Q4 and full-year results
In this article we look at the Anglo American share price and estimates ahead of the Q4 and FY20 results.


Anglo American results preview: what does the Street expect?
The Anglo American earnings are preceded by results from its major subsidiaries Anglo American Platinum (Amplats) and Kumba Iron Ore which have already been released. The Amplats results showed a strong financial performance in 2020 financial year (FY20), underpinned by more than 70% increase in the underlying rand basket price of Platinum Group Metals (PGMs). Kumba Iron Ore has seen the recent run in the steel-making ingredient help push full year earnings for the group more than 40% higher.
The lower output of platinum (-14%) and iron ore (-7%) in FY20 was offset by the higher pricings realised for these commodities over the period. Copper, manganese and nickel production in FY20 has been flat to marginally higher for the group, although prices for these commodities have gained over the financial year. Diamond and coal output has seen the steepest contraction for Anglo American Plc in 2020.
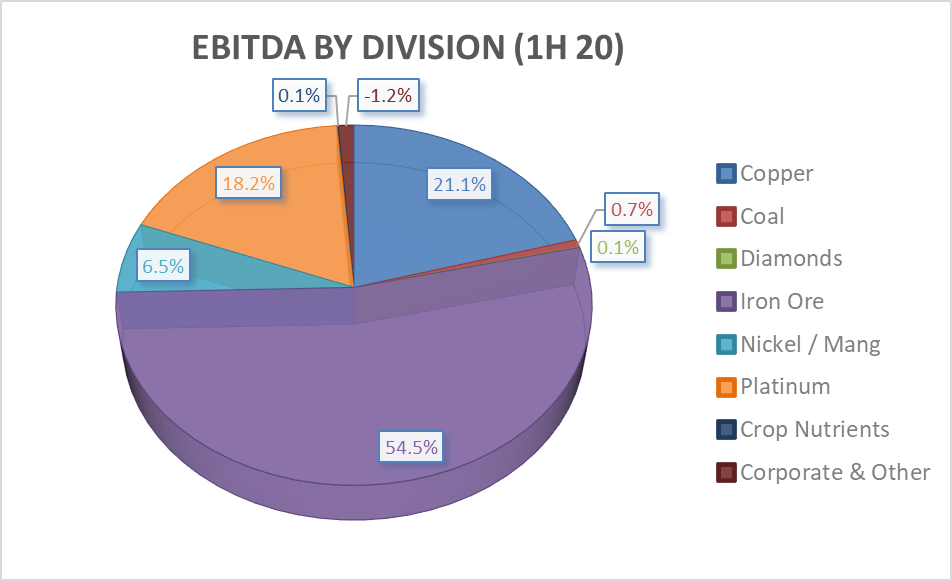
The below pie chart shows the division of earnings before interest, tax, depreciation and amortisation (EBITDA). iron ore remains the most material contributor to Anglo American earnings, and combined with copper and platinum, these metals account for more than 90% of total group EBITDA.
In terms of the upcoming results, consensus estimates as sourced from Refinitiv Data arrive at the following:
- FY20 revenue of $28,591m (-4.28% year on year)
- FY20 EBITDA of $9,118m (-8.8% year on year)
How to trade the Anglo American results
The below two graphics provide traders with both a retail short term view on the stock, as well as an institutional longer-term view on the Anglo American PLC (AAL) share price, as to how market participants are positioned ahead of the full year earnings release.

A Thomson Reuters poll of 24 analysts maintain a long-term average rating of ‘Buy’ for Anglo American (as of 23 February 2021).A Thomson Reuters poll of 24 analysts maintain a long-term average rating of ‘Buy’ for Anglo American (as of 23 February 2021).

From a retail trader perspective (as of 23 February 2021), 73% of IG clients with open positions on Anglo American (AAL) expect the share price to rise over the near term, while 27% of IG Clients with open positions expect the price to fall.
Anglo American share price (AAL): technical analysis

The share price of Anglo American (AAL), while trading within a longer-term channel and uptrend, is currently retracing from overbought territory at present. The overbought signal is not considered a signal to short Anglos from current, but rather a suggestion that traders respecting the longer-term uptrend might find a better opportunity for long entry.
A confluence of support at 25.80 becomes a short-term target from the current correction under way. Traders looking for long entry might prefer to wait for a bullish reversal closer to this support level, before targeting a move back to the recent high, and possibly channel resistance at 31.
Summary
- Anglo American full-year results are scheduled for release on 25 February
- Group revenue and EBITDA for FY20 is expected to have decreased marginally year on year
- The average long-term broker rating for Anglo American is ‘Buy’
- IG clients with open positions on Anglo American expect the price to rise in the near term
- A technical analysis view on the company shows a short term correction of a longer-term uptrend currently underway
IGA, may distribute information/research produced by its respective foreign affiliates within the IG Group of companies pursuant to an arrangement under Regulation 32C of the Financial Advisers Regulations. Where the research is distributed in Singapore to a person who is not an Accredited Investor, Expert Investor or an Institutional Investor, IGA accepts legal responsibility for the contents of the report to such persons only to the extent required by law. Singapore recipients should contact IGA at 6390 5118 for matters arising from, or in connection with the information distributed.
The information/research herein is prepared by IG Asia Pte Ltd (IGA) and its foreign affiliated companies (collectively known as the IG Group) and is intended for general circulation only. It does not take into account the specific investment objectives, financial situation, or particular needs of any particular person. You should take into account your specific investment objectives, financial situation, and particular needs before making a commitment to trade, including seeking advice from an independent financial adviser regarding the suitability of the investment, under a separate engagement, as you deem fit.
No representation or warranty is given as to the accuracy or completeness of this information. Consequently, any person acting on it does so entirely at their own risk. Please see important Research Disclaimer.
Please also note that the information does not contain a record of our trading prices, or an offer of, or solicitation for, a transaction in any financial instrument. Any views and opinions expressed may be changed without an update.

Seize a share opportunity today
Go long or short on thousands of international stocks.
- Increase your market exposure with leverage
- Get spreads from just 0.1% on major global shares
- Trade CFDs straight into order books with direct market access
Live prices on most popular markets
- Forex
- Shares
- Indices
See more forex live prices
See more shares live prices
Prices above are subject to our website terms and agreements. Prices are indicative only. All shares prices are delayed by at least 15 mins.
See more indices live prices
Prices above are subject to our website terms and agreements. Prices are indicative only. All shares prices are delayed by at least 20 mins.
