Asia Day Ahead: Gold at March 2023 low, USD/JPY hovers below key 150.00 level
A slight breather in the Treasury yields rally allowed Wall Street to turn in a positive session overnight, while VIX retraced for the second straight day.


Market Recap
A slight breather in the Treasury yields rally allowed Wall Street to turn in a positive session overnight, while VIX retraced for the second straight day after nearing its key psychological 20 level, which are generally looked upon as the divide between stable or more stressful periods. The rate-sensitive Nasdaq 100 index found room for greater relief (+0.8%) and if it manages to close at or above the current level today, that could help form a weekly bullish pin bar to kickstart next week.
Overnight, the final read for US 2Q gross domestic product (GDP) offered mixed views. A significant downward revision in consumer spending (0.8% vs previous 1.7%) may question how far the current economic resilience may last, but at least for now, the weakness was masked by an upward revision to business fixed investment (7.4% vs previous 6.1%). Overall, that supported a still-resilient 2Q growth expansion of 2.1%, in line with expectations.
Ahead, the US Personal Consumption Expenditure (PCE) price index data will be on watch, which is expected to display stronger growth in headline inflation (3.5% vs previous 3.3%), but further moderation in the core aspect (3.9% vs previous 4.2%). If it turns out as expected, this may mark a new low in core PCE inflation since October 2021 and provides some validation for current rate expectations that the Fed may not follow through with its last rate hike in November/December.
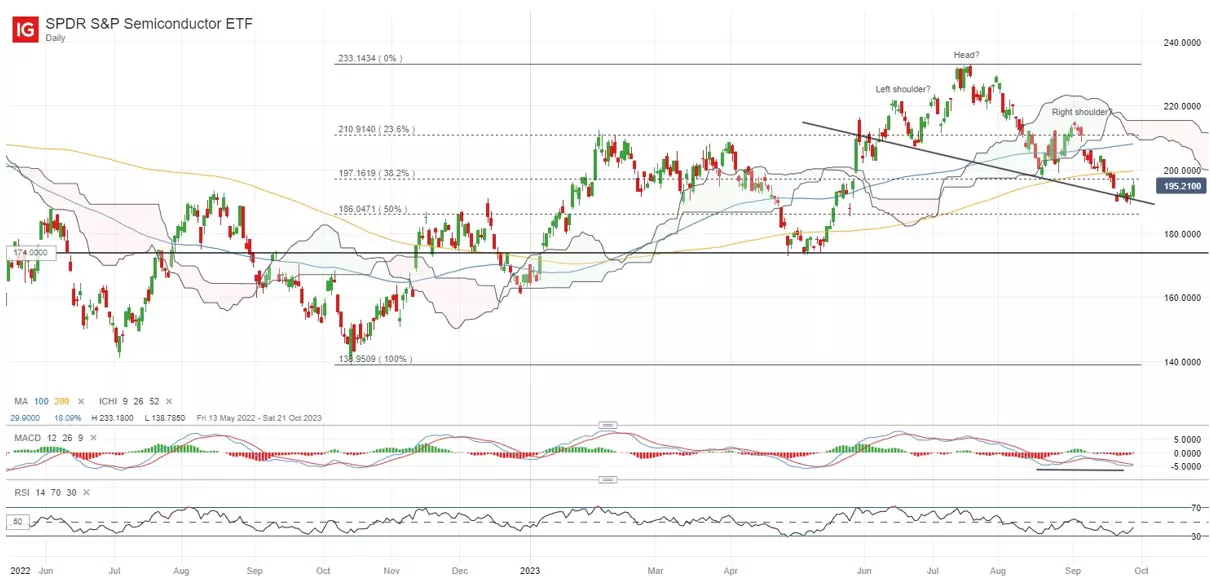
One to watch may be the SPDR S&P Semiconductor ETF, which managed to defend the neckline of a head-and-shoulder formation on the daily chart, while its daily Moving Average Convergence/Divergence (MACD) is attempting for a bullish crossover. A series of resistance still lies ahead for the sector to overcome, with the daily Relative Strength Index (RSI) still trading below the 50 level as an indication of sellers in control. On the upside, immediate resistance may stand at the 200.00 level, while any failure to defend the neckline may pave the way to retest the 174.00 level next.
Asia Open
Asian stocks look set for a slight positive open, with Nikkei+0.02%, ASX +0.28% and NZX +0.45% at the time of writing. Given that several markets are closed for holiday today (China and Taiwan closed for Mid-Autumn Festival, South Korea closed for Chuseok), overall sentiments could be more subdued, despite lower bond yields and a weaker US dollar providing room for some near-term relief.
Economic data this morning saw a lower-than-expected core consumer price index (CPI) read in Tokyo (2.5% vs 2.6% forecast), which is generally looked upon as a precursor to the nationwide inflation number. Tokyo’s headline inflation has also turned in softer at 2.8% from previous 2.9%, registering its lowest level since September 2022. The still-declining growth trend in core inflation may not provide the conviction for the Bank of Japan’s (BoJ) ‘sustainable 2% inflation’ condition for a policy pivot just yet, although rate expectations remain firm that the central bank may be forced to abandon its negative interest rate policy in 1Q 2024.
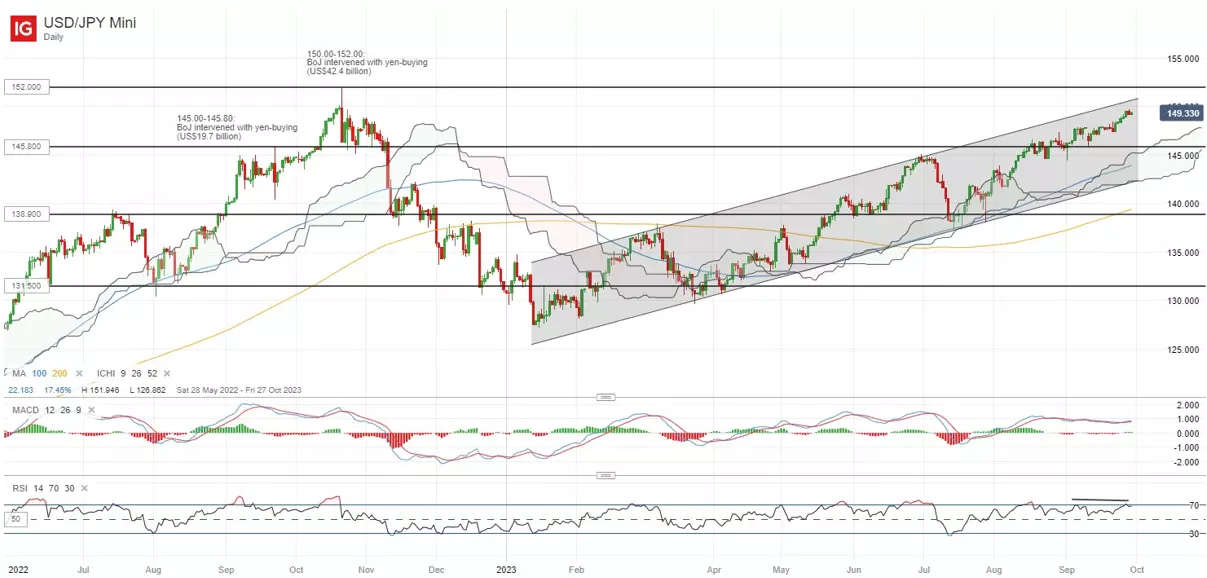
The USD/JPY continues to trade within an upward channel pattern for now, supported by widening US-Japan bond yield differentials in light of the ongoing policy divergence between both central banks. But as the pair nears the key psychological 150.00 level, which marked the Japanese authorities’ intervention efforts back in October 2022, market watchers has grown more wary that they may pull the trigger once more, with the heavy net-short positioning in Japanese yen speculative bets potentially accelerating any move to the downside for the USD/JPY. The 150.00 level remains a key resistance to overcome, while on the downside, the 148.00 may serve as immediate support to hold, followed by the 145.80 level.
On the watchlist: Gold prices at March 2023 low
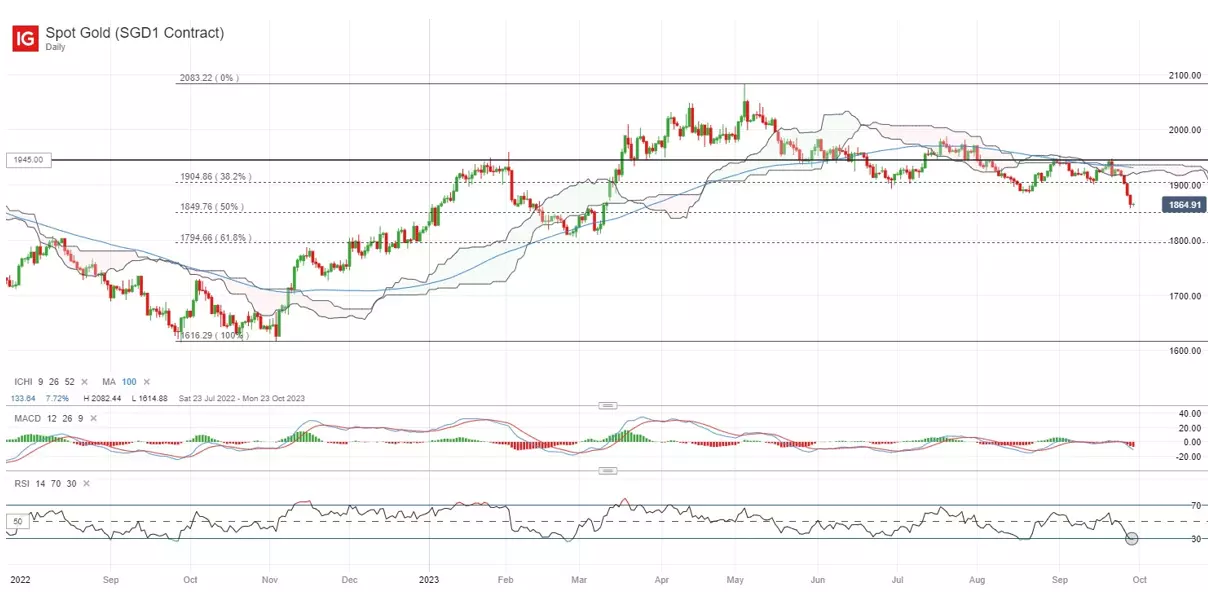
Despite some cooling in the US Treasury yields rally and a weaker US dollar overnight, gold prices did not manage to gain much traction overnight, hovering around its lowest level since March 2023. Near-term technical conditions in oversold levels may translate to an attempt to stabilise ahead, but the broader trend remains downward bias, given the formation of lower highs and lower lows since May 2023.
To reinforce sellers in broader control for now, its weekly RSI continues to trade below the 50 level. Any relief may leave the resistance level at the US$1,900 level on watch for buyers to overcome, with more conviction for buyers potentially having to come from a move back above its 100-day moving average (MA).
Thursday: DJIA +0.35%; S&P 500 +0.59%; Nasdaq +0.83%, DAX +0.70%, FTSE +0.11%
IGA, may distribute information/research produced by its respective foreign affiliates within the IG Group of companies pursuant to an arrangement under Regulation 32C of the Financial Advisers Regulations. Where the research is distributed in Singapore to a person who is not an Accredited Investor, Expert Investor or an Institutional Investor, IGA accepts legal responsibility for the contents of the report to such persons only to the extent required by law. Singapore recipients should contact IGA at 6390 5118 for matters arising from, or in connection with the information distributed.
The information/research herein is prepared by IG Asia Pte Ltd (IGA) and its foreign affiliated companies (collectively known as the IG Group) and is intended for general circulation only. It does not take into account the specific investment objectives, financial situation, or particular needs of any particular person. You should take into account your specific investment objectives, financial situation, and particular needs before making a commitment to trade, including seeking advice from an independent financial adviser regarding the suitability of the investment, under a separate engagement, as you deem fit.
No representation or warranty is given as to the accuracy or completeness of this information. Consequently, any person acting on it does so entirely at their own risk. Please see important Research Disclaimer.
Please also note that the information does not contain a record of our trading prices, or an offer of, or solicitation for, a transaction in any financial instrument. Any views and opinions expressed may be changed without an update.

Seize a share opportunity today
Go long or short on thousands of international stocks.
- Increase your market exposure with leverage
- Get spreads from just 0.1% on major global shares
- Trade CFDs straight into order books with direct market access
Live prices on most popular markets
- Forex
- Shares
- Indices
See more forex live prices
See more shares live prices
Prices above are subject to our website terms and agreements. Prices are indicative only. All shares prices are delayed by at least 15 mins.
See more indices live prices
Prices above are subject to our website terms and agreements. Prices are indicative only. All shares prices are delayed by at least 20 mins.
