AUD/USD gains amidst hawkish signals: focus on CPI data and RBA outlook
AUD/USD gains 1.07%, reaching four-month high. Hawkish RBA, softer USD, and economic data drive momentum.


Last week saw a second straight week of gains for the AUD/USD, closing 1.07% higher at .6585, its highest weekly close in four months.
The AUD/USD rally persisted as the USD slid post-weaker-than-anticipated US CPI data. Improved global risk sentiment, coupled with hawkish RBA tones and news of Chinese government support for struggling property developers, further fuelled the local unit's strength.
Whether that run will be extended will depend, to some extent, on the release of two key pieces of Australian economic data. The first of which is retail sales on Tuesday and the monthly CPI indicator on Wednesday.
What to expect from monthly CPI indicator
Earlier this month, the RBA raised the cash rate by 25bp to 4.35%. The RBA's first rate rise since June was widely expected after Q3 inflation surprised to the upside.
The past week, RBA communique has taken a more hawkish tilt, with the minutes from the board meeting noting that the bank's latest forecasts "were predicated on an additional one to two increases in the cash rate over coming quarters."
Speaking at the annual ABE dinner in Sydney last Wednesday night, RBA Governor Michele Bullock struck another hawkish note, stating that inflation remains too high and is "increasingly homegrown."
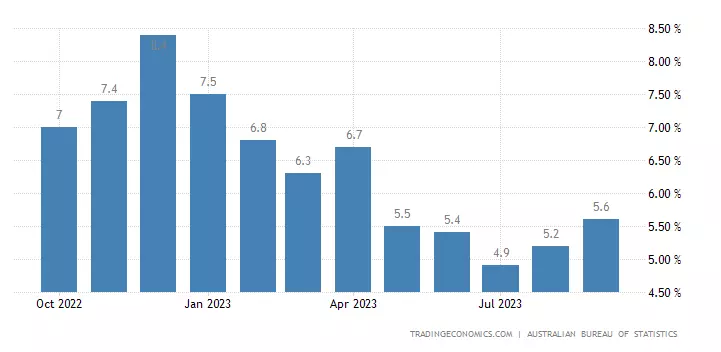
This week, the market is looking for the monthly CPI indicator to fall to 5.2% YoY from 5.6% in September. Presuming the monthly indicator does not surprise to the upside, the RBA will more than likely stay on hold at its meeting in December.
However, with inflation still well above the RBA's 2-3% target, there is good reason why the interest rate market is assigning a 45% chance the RBA will hike rates by 25bp in February to 4.60%.
Monthly CPI indicator chart
AUD/USD technical analysis
After four unsuccessful attempts, the AUD/USD broke through the .6520/30 resistance last week, only to encounter resistance at .6590, stemming from the 200-day moving average
While there is a likelihood that the AUD/USD could establish a medium-term low around October's .6270, we refrain from initiating new long positions before crossing the 200-day moving average (currently at .6585) and ahead of crucial Australian and US inflation data releases
However, post the data, should the AUD/USD see a sustained break above the 200-day moving average at .6585/00, it opens the way for the rally to extend towards the next important layer of resistance at .6800/20. Downside support is viewed at .6520/00.

- Source Tradingview. The figures stated are as of 27 November 2023. Past performance is not a reliable indicator of future performance. This report does not contain and is not to be taken as containing any financial product advice or financial product recommendation.
IGA, may distribute information/research produced by its respective foreign affiliates within the IG Group of companies pursuant to an arrangement under Regulation 32C of the Financial Advisers Regulations. Where the research is distributed in Singapore to a person who is not an Accredited Investor, Expert Investor or an Institutional Investor, IGA accepts legal responsibility for the contents of the report to such persons only to the extent required by law. Singapore recipients should contact IGA at 6390 5118 for matters arising from, or in connection with the information distributed.
The information/research herein is prepared by IG Asia Pte Ltd (IGA) and its foreign affiliated companies (collectively known as the IG Group) and is intended for general circulation only. It does not take into account the specific investment objectives, financial situation, or particular needs of any particular person. You should take into account your specific investment objectives, financial situation, and particular needs before making a commitment to trade, including seeking advice from an independent financial adviser regarding the suitability of the investment, under a separate engagement, as you deem fit.
No representation or warranty is given as to the accuracy or completeness of this information. Consequently, any person acting on it does so entirely at their own risk. Please see important Research Disclaimer.
Please also note that the information does not contain a record of our trading prices, or an offer of, or solicitation for, a transaction in any financial instrument. Any views and opinions expressed may be changed without an update.

Explore the markets with our free course
Discover and learn how the range of markets you can trade on with IG Academy's online course – ‘Introducing the financial markets’.
Put learning into action
Try out what you’ve learned in this shares strategy article risk-free in your demo account.
Ready to trade shares?
Put the lessons in this article to use in a live account – upgrading is quick and easy.
- Trade on over 10,000 popular global stocks
- Protect your capital with risk management tools
- React to breaking news with out-of-hours trading on 70 key US stocks
Inspired to trade?
Put your new knowledge into practice. Log in to your account now.
Live prices on most popular markets
- Forex
- Shares
- Indices
See more forex live prices
See more shares live prices
Prices above are subject to our website terms and agreements. Prices are indicative only. All shares prices are delayed by at least 15 mins.
See more indices live prices
Prices above are subject to our website terms and agreements. Prices are indicative only. All shares prices are delayed by at least 20 mins.
