FOMC meeting preview; what's next for the S&P 500, Nasdaq
Anticipation looms in the markets ahead of the FOMC meeting minutes release on Thursday at 6 am AEDT.

FOMC meeting
The minutes from the January FOMC meeting will be released on Thursday at 6 am AEDT.
At the meeting, the FOMC increased the Fed Funds rate by 25 bp to 4.5-4.75%. The smaller move followed a 50 bp increase in December and four gigantic 75 bp rake hikes before that.
The Fed said that further rate increases would be required in the statement that accompanied the decision.
“The Committee anticipates that ongoing increases in the target range will be appropriate in order to attain a stance of monetary policy that is sufficiently restrictive to return inflation to 2 percent over time.”
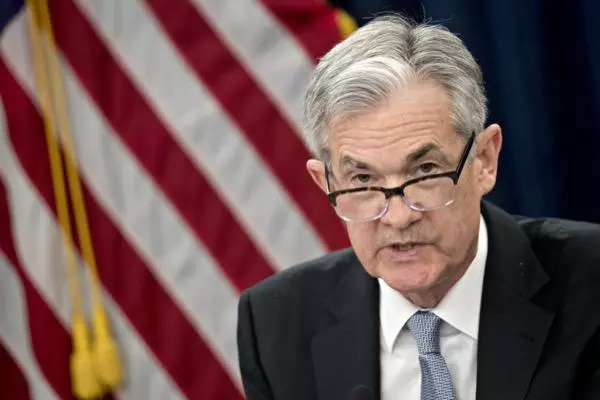
However, in the press conference that followed, Fed Chair Powell raised expectations that rates were close to a peak, noting that the “disinflationary process has begun” and that it was “certainly possible” the Fed would keep its benchmark rate below 5%.
The events that have transpired since the January FOMC meeting, including a run of hot economic data and hawkish Fed speeches, have rendered the Fed meeting minutes and accompanying comments mostly outdated.
Yields
Yields have moved sharply higher, leaving the US interest rate market almost fully priced for 25 bp rate hikes in March and May and 70% priced for a 25 bp rate hike in June which would take the Feds target rate to 5.25-5.50%.
A terminal Fed Funds rate with a five handle in front of it doesn’t seem quite high enough in the context of an inflation rate still at twice the Feds target and an unemployment rate at 3.4%, the lowest level since 1969.
In the past, higher yields and expectations of additional Fed rate hikes would have undercut equities and other risk assets. However, with the market swapping the “hard landing” narrative of Q4 2022 to one of “no landing” in Q1 2023, US equities have been well supported.
Their resilience relates to the idea that equity markets can withstand higher rates if strong economic growth drives yields as opposed to a hawkish Fed playing catchup to runaway inflation.
S&P 500 technical analysis
With that thought in mind, providing the S&P 500 remains above uptrend support and the 200-day moving average 3985/50, allow the rally from the October lows (viewed as countertrend or corrective) to reach the August 4327 high before fading.
Aware that a sustained close back below the 200-day moving average and uptrend support 3985/50 would confirm that the rally from the October lows has been corrective and the downtrend has resumed.
S&P 500 daily chart

Nasdaq technical analysis
Providing the Nasdaq remains above the support from the 200-day MA at 12,000, allow the rally from the October low to extend past resistance from the recent 12950 high towards the August 13,740 high before fading.
Aware that a sustained close back below the 200-day MA of ~12,000 would confirm that the rally from the October lows has been corrective and the downtrend has resumed.
Nasdaq daily chart

IGA, may distribute information/research produced by its respective foreign affiliates within the IG Group of companies pursuant to an arrangement under Regulation 32C of the Financial Advisers Regulations. Where the research is distributed in Singapore to a person who is not an Accredited Investor, Expert Investor or an Institutional Investor, IGA accepts legal responsibility for the contents of the report to such persons only to the extent required by law. Singapore recipients should contact IGA at 6390 5118 for matters arising from, or in connection with the information distributed.
The information/research herein is prepared by IG Asia Pte Ltd (IGA) and its foreign affiliated companies (collectively known as the IG Group) and is intended for general circulation only. It does not take into account the specific investment objectives, financial situation, or particular needs of any particular person. You should take into account your specific investment objectives, financial situation, and particular needs before making a commitment to trade, including seeking advice from an independent financial adviser regarding the suitability of the investment, under a separate engagement, as you deem fit.
No representation or warranty is given as to the accuracy or completeness of this information. Consequently, any person acting on it does so entirely at their own risk. Please see important Research Disclaimer.
Please also note that the information does not contain a record of our trading prices, or an offer of, or solicitation for, a transaction in any financial instrument. Any views and opinions expressed may be changed without an update.

Explore the markets with our free course
Discover the range of markets you can spread bet on - and learn how they work - with IG Academy's online course.
Turn knowledge into success
Practice makes perfect. Take what you’ve learned in this index strategy article, and try it out risk-free in your demo account.
Ready to trade indices?
Put the lessons in this article to use in a live account. Upgrading is quick and simple.
- Get fixed spreads from 1 point on FTSE 100 and Germany 40
- Protect your capital with risk management tools
- Trade more 24-hour markets than any other provider – 26 in total
Inspired to trade?
Put the knowledge you’ve gained from this article into practice. Log in to your account now.
Live prices on most popular markets
- Forex
- Shares
- Indices
See more forex live prices
See more shares live prices
Prices above are subject to our website terms and agreements. Prices are indicative only. All shares prices are delayed by at least 15 mins.
See more indices live prices
Prices above are subject to our website terms and agreements. Prices are indicative only. All shares prices are delayed by at least 20 mins.
