Oil price nosedives below $90: is the rally over?
Despite Saudi Arabia and Russia maintain their oil production cut till the end of the year, concerns regarding the deteriorating economic environment seem to have taken precedence, resulting in a decline of over 9% in just a week.


Oil price tanks despite OPEC+ maintains production cuts
Despite Saudi Arabia and Russia announced to maintain their oil production cut until the end of the year in this week's OPEC+ meeting, concerns regarding the deteriorating economic environment seem to have taken precedence, resulting in a notable drop in energy prices to below $90 per barrel—a decline of over 9% in just one week.
Oil prices witnessed an 8% surge in September alone and a 29% increase throughout the third quarter, primarily due to the joint efforts of Saudi Arabia and Russia, who decided to reduce their daily supplies by over 1 million barrels from mid-year, leading to the fastest depletion of global inventories in years.
However, the market's reaction this week seemly suggests that the rally may be losing steam, with attentions shifting elsewhere. It's not unlikely that the demand side of the market is exploring alternative options in response to soaring oil prices. Meanwhile, the prevailing narrative of higher and more prolonged interest rates is bringing the possibility of a recession back in sight. Both of these scenarios would weigh on the outlook for oil demand.
Nevertheless, it may be premature to declare the end of the rally, given the ongoing constraints on oil supply. According to the EIA Petroleum Status Report released on October 3rd, crude oil stocks in the US declined by 4.21 million barrels in the week ending September 29th, marking the sixth week of drawdown in the last eight weeks. Furthermore, on a global scale, the International Energy Agency has issued a warning that the production cuts implemented by these two major oil suppliers could lead to a "significant supply shortfall" by the year's end.
Meanwhile, as the northern hemisphere enters its winter season, historical patterns indicate an increase in demand for heating oil, which could further intensify the tightening of global oil stocks.
The next OPEC+ meeting is scheduled for November 26th, when all 23 OPEC+ nations will gather to discuss their outlook and plan for 2024.
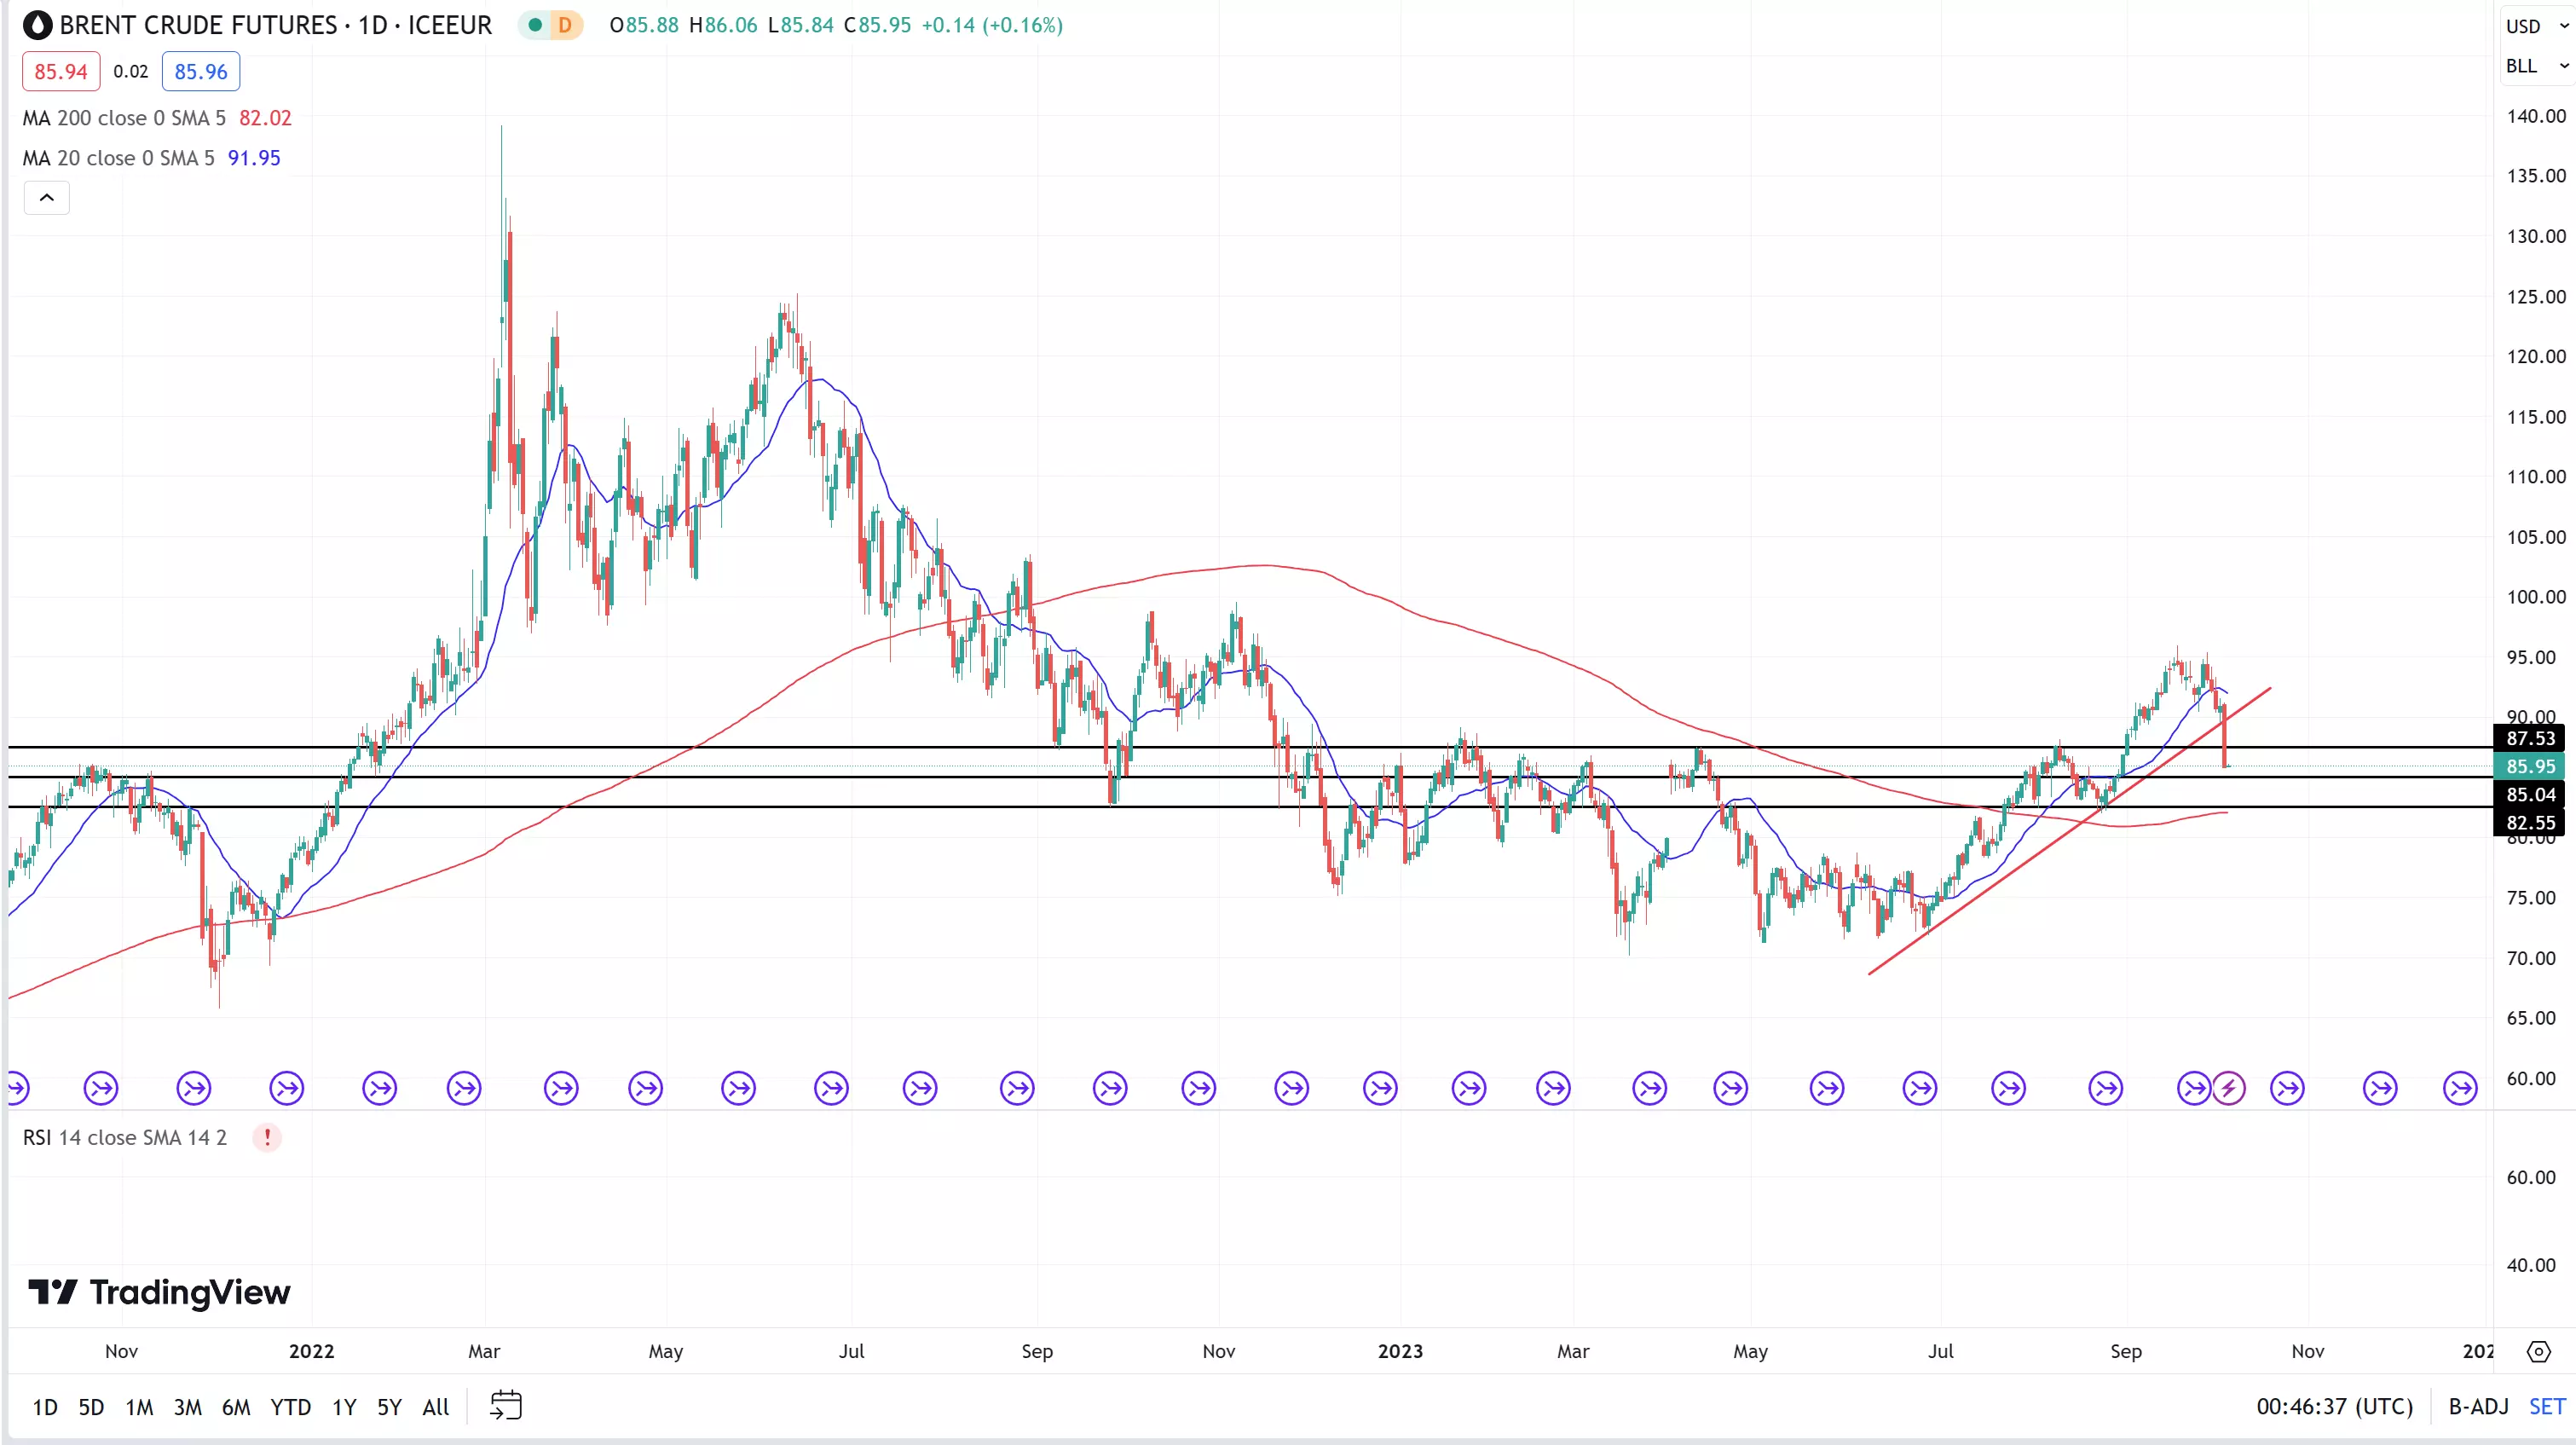
Brent crude technical analysis
On the daily chart displayed below, the price of Brent crude has convincingly breached the trendline dating back to June and is currently trading below the 20-day moving average.
In the short term, the level of $87.53 is expected to play as a critical resistance point, as it previously served as the peak for both April and August. Conversely, recent losses may lead the price to seek support at $85.04, and a further pullback from that point could shift attention towards the August low, around $82.69, coinciding with the current position of the 200-day moving average.
IGA, may distribute information/research produced by its respective foreign affiliates within the IG Group of companies pursuant to an arrangement under Regulation 32C of the Financial Advisers Regulations. Where the research is distributed in Singapore to a person who is not an Accredited Investor, Expert Investor or an Institutional Investor, IGA accepts legal responsibility for the contents of the report to such persons only to the extent required by law. Singapore recipients should contact IGA at 6390 5118 for matters arising from, or in connection with the information distributed.
The information/research herein is prepared by IG Asia Pte Ltd (IGA) and its foreign affiliated companies (collectively known as the IG Group) and is intended for general circulation only. It does not take into account the specific investment objectives, financial situation, or particular needs of any particular person. You should take into account your specific investment objectives, financial situation, and particular needs before making a commitment to trade, including seeking advice from an independent financial adviser regarding the suitability of the investment, under a separate engagement, as you deem fit.
No representation or warranty is given as to the accuracy or completeness of this information. Consequently, any person acting on it does so entirely at their own risk. Please see important Research Disclaimer.
Please also note that the information does not contain a record of our trading prices, or an offer of, or solicitation for, a transaction in any financial instrument. Any views and opinions expressed may be changed without an update.

Trade on commodities
Trade commodity futures, as well as 27 commodity markets with no fixed expiries.1
- Wide range of popular and niche metals, energies and softs
- Spreads from 0.3 pts on Spot Gold, 2 pts on Spot Silver and 2.8 pts on Oil
- View continuous charting, backdated for up to five years
1In the case of all DFBs, there is a fixed expiry at some point in the future.
Live prices on most popular markets
- Forex
- Shares
- Indices
See more forex live prices
See more shares live prices
Prices above are subject to our website terms and agreements. Prices are indicative only. All shares prices are delayed by at least 15 mins.
See more indices live prices
Prices above are subject to our website terms and agreements. Prices are indicative only. All shares prices are delayed by at least 20 mins.
