What to expect for Hang Seng Index?
Hang Seng Index is down close to 12.8% year to date. What lies ahead?


Hang Seng Index – what weighs?
Year to date (YTD), the Hang Seng Index remained in the red with -12.8% total return, largely trailing behind its global peers such as Nikkei’s 4.1% and S&P 500’s 25.7%. With Chinese big tech firms accounting for a significant weightage of more than 25%, the uncertainty surrounding regulatory risks have kept investors shunning. Some dip buying was seen since August this year but renewed delisting fears of US-listed Chinese firms have led the Hang Seng Tech index to tumble to a new low since launch.
The property sector also provides another headwind, accounting for 7.4% of overall weightage. With China Evergrande showing signs that an official default is very likely, the onus seems to fall on the China authorities to mitigate its contagion risks. Further default may lie ahead, with the Hang Seng Properties Index down 6.7% YTD.
What’s next?
That said, while risk factors continue to linger, some pockets of optimism may be surfacing, at least in the near term. Based on the daily southbound Hong Kong stock connect net turnover, net inflows on a 20-day moving average have reverted to positive territory (above the zero-mark) lately. Previous occasion in September where there is a reversion, the index was met with near-term upside although the momentum did not seem to last through November.

China authorities have also reacted to its economic slowdown with a 50-bps cut in the reserve requirement ratio (RRR), a widely anticipated move which will release 1.2 trillion yuan of long-term liquidity to banks. While the impact may be offset by some maturing medium-term lending facility (MLF) to come, the overall increase in funds for lending may mark an ongoing step towards stabilising its economic conditions, potentially with more impending supportive policy measures.
Recent economic data has also delivered positive surprises, with industrial output and retail sales outperforming expectations, seemingly a sign of resilience towards supply shortages and virus restrictions. The property sector undoubtedly has shown to be the weighing factor and while virus risks remain, the absence of any Omicron headlines pertaining to it being more severe is aiding to underpin sentiments.

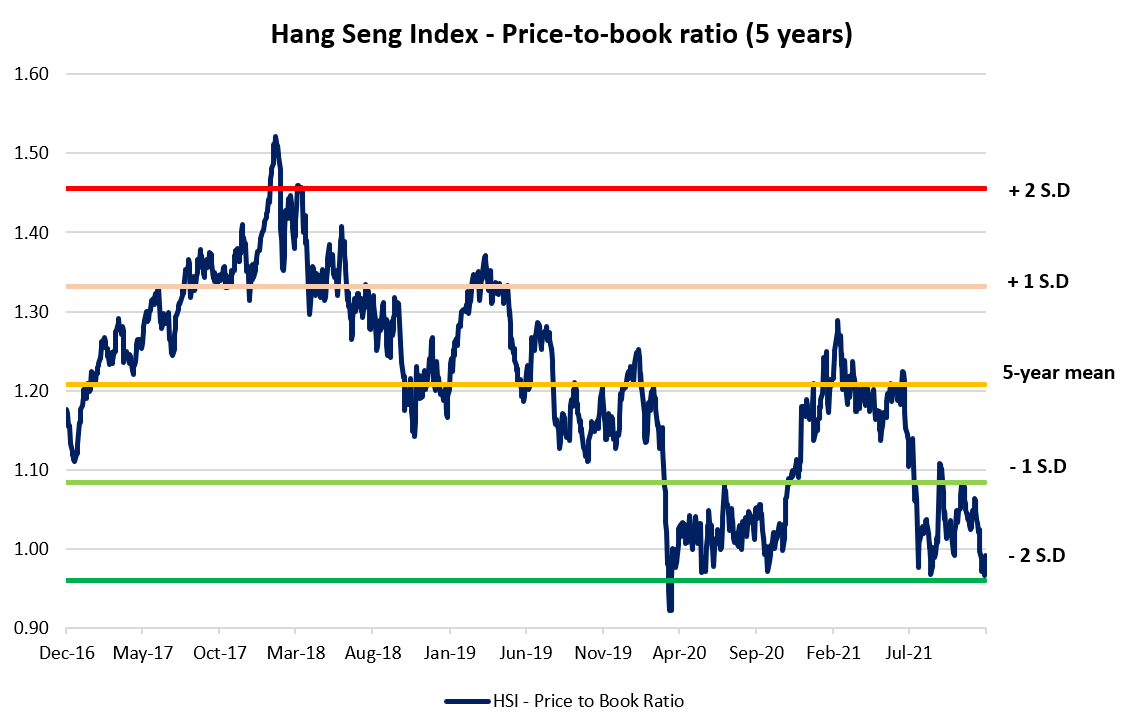
Valuation
A look at the Hang Seng Index’s price-to-book (P/B) ratio reveals that current valuation is trading at two standard deviations below its five-year mean. With its P/B at 0.99, it is close to the Covid-19 sell-off back in early 2020, which is its lowest historical P/B ratio to date.
Relative to the Nikkei and KOSPI’s P/B at 1.89 and 1.10, respectively, its valuation seems to be trailing behind. This suggests that there may be room for some catch-up growth ahead, in the event its regulatory and economic environment turn for the better.
Technical analysis
On the daily chart, the longer-term downtrend remains with lower highs and lower lows in place since February this year. That said, the index is retesting its support-turned-resistance level at 24,000, where the Fibonacci 76.4% level lies from its Covid-19 bottom to February’s peak.
With the relative strength index (RSI) revealing higher lows over the past week, it suggests that downside momentum may be waning in the near term. Along with a moving average convergence divergence (MACD) bullish crossover in formation, these signs show an increase the chances of a near-term rebound. A successful break above this 24,000 level may potentially draw further upside to the 24,800 level next, where some resistance may be expected with the Fibonacci 61.8% level coinciding with a downward trendline.

On the monthly chart, the index is currently hanging above the lower trendline of an ascending channel pattern, which has been supporting the index on previous three occasions. One may watch if the support line holds. If the channel pattern continues to play out, it may suggest longer-term upside to the 30,000 psychological level.

IGA, may distribute information/research produced by its respective foreign affiliates within the IG Group of companies pursuant to an arrangement under Regulation 32C of the Financial Advisers Regulations. Where the research is distributed in Singapore to a person who is not an Accredited Investor, Expert Investor or an Institutional Investor, IGA accepts legal responsibility for the contents of the report to such persons only to the extent required by law. Singapore recipients should contact IGA at 6390 5118 for matters arising from, or in connection with the information distributed.
The information/research herein is prepared by IG Asia Pte Ltd (IGA) and its foreign affiliated companies (collectively known as the IG Group) and is intended for general circulation only. It does not take into account the specific investment objectives, financial situation, or particular needs of any particular person. You should take into account your specific investment objectives, financial situation, and particular needs before making a commitment to trade, including seeking advice from an independent financial adviser regarding the suitability of the investment, under a separate engagement, as you deem fit.
No representation or warranty is given as to the accuracy or completeness of this information. Consequently, any person acting on it does so entirely at their own risk. Please see important Research Disclaimer.
Please also note that the information does not contain a record of our trading prices, or an offer of, or solicitation for, a transaction in any financial instrument. Any views and opinions expressed may be changed without an update.

Seize a share opportunity today
Go long or short on thousands of international stocks.
- Increase your market exposure with leverage
- Get spreads from just 0.1% on major global shares
- Trade CFDs straight into order books with direct market access
Live prices on most popular markets
- Forex
- Shares
- Indices
See more forex live prices
See more shares live prices
Prices above are subject to our website terms and agreements. Prices are indicative only. All shares prices are delayed by at least 15 mins.
See more indices live prices
Prices above are subject to our website terms and agreements. Prices are indicative only. All shares prices are delayed by at least 20 mins.
