Where now for the Nasdaq 100?
Tech stocks have powered higher in recent months and the Nasdaq 100 now sits at a record high once more. Can this run continue?


Back in the first half of 2021, there was no shortage of gloomy commentary about tech stocks. From being the market stars of the past year, it seemed tech had run out of room to rally.
The expected reopening of the global economy was foretold to be the moment that investors would move away from the FANG winners of 2020 and find sectors and companies that would benefit from people leaving their homes and returning to physical shopping and working from offices, rather than working and shopping from the comfort of their homes.
Perhaps unsurprisingly, this has not come to pass. Indeed, fund managers have rediscovered the attractions of the sector, with huge inflows over the recent weeks that has played a major part in driving the Nasdaq 100 to a new record high, taking out the 15,000 level for the first time in its history.
For a time, it looked like big tech stocks like Amazon would continue to struggle. A stellar year in 2020 meant that stock prices of FANG names had risen very quickly, but from September onwards the relentless gains began to stall.
Other sectors began to take over the mantle of leadership, and a rise in treasury yields seemed to suggest that the era of buying tech stocks had come to a close, given their valuations were so high that much of the risk appeared to be skewed to the downside.
The Nasdaq 100 currently sits at a record high, having enjoyed huge gains since May. Sentiment surrounding this index and the heavyweight names such as Amazon has undergone a major shift over the past six months, as investors switched from growth to value and then back again.
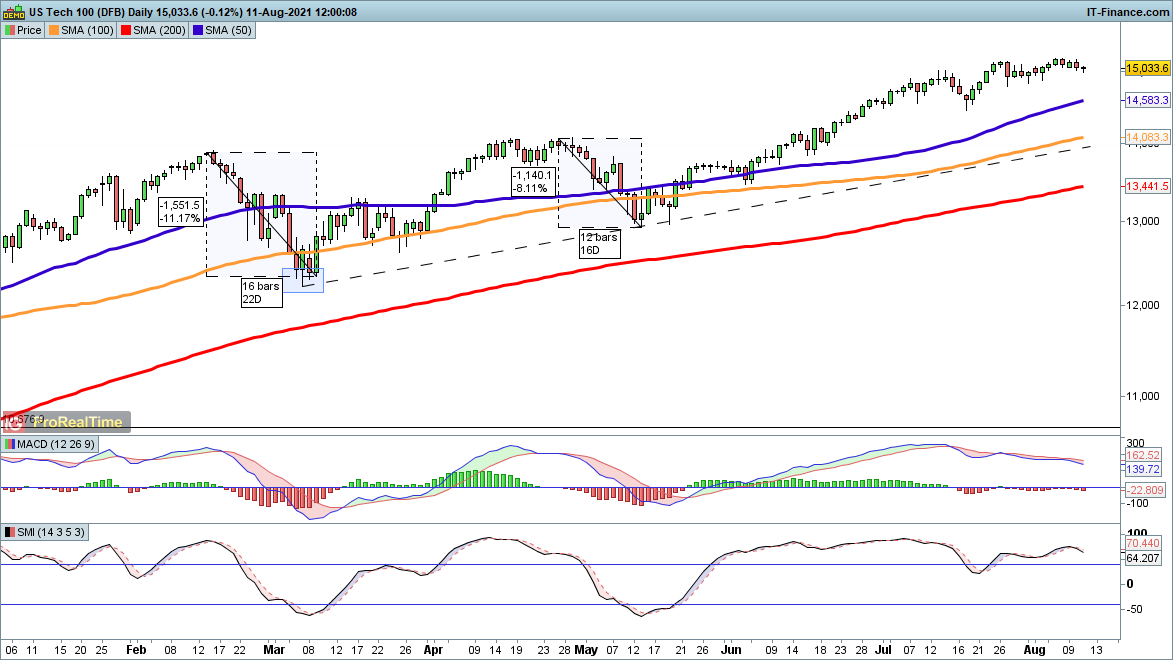
From a chart standpoint, the trend is firmly intact, and has been substantially revived since the uncertain February – May period. From May we have seen a renewed surge to the upside, as inflows have supported the sector and pushed it to a new record high.
We have now gone an extended period without any major volatility, and historically August-September can see some weakness creep in before a year-end rally gets underway.
But investors appear to have woken up to the strong fundamentals of the sector, particularly the cash-generation powers of the big FANG stocks, and have found renewed faith in growth stocks and their ability to deliver strong market returns.
IGA, may distribute information/research produced by its respective foreign affiliates within the IG Group of companies pursuant to an arrangement under Regulation 32C of the Financial Advisers Regulations. Where the research is distributed in Singapore to a person who is not an Accredited Investor, Expert Investor or an Institutional Investor, IGA accepts legal responsibility for the contents of the report to such persons only to the extent required by law. Singapore recipients should contact IGA at 6390 5118 for matters arising from, or in connection with the information distributed.
The information/research herein is prepared by IG Asia Pte Ltd (IGA) and its foreign affiliated companies (collectively known as the IG Group) and is intended for general circulation only. It does not take into account the specific investment objectives, financial situation, or particular needs of any particular person. You should take into account your specific investment objectives, financial situation, and particular needs before making a commitment to trade, including seeking advice from an independent financial adviser regarding the suitability of the investment, under a separate engagement, as you deem fit.
No representation or warranty is given as to the accuracy or completeness of this information. Consequently, any person acting on it does so entirely at their own risk. Please see important Research Disclaimer.
Please also note that the information does not contain a record of our trading prices, or an offer of, or solicitation for, a transaction in any financial instrument. Any views and opinions expressed may be changed without an update.

Take a position on indices
Deal on the world’s major stock indices today.
- Trade the lowest Wall Street spreads on the market
- 1-point spread on the FTSE 100 and Germany 40
- The only provider to offer 24-hour pricing
Live prices on most popular markets
- Forex
- Shares
- Indices
See more forex live prices
See more shares live prices
Prices above are subject to our website terms and agreements. Prices are indicative only. All shares prices are delayed by at least 15 mins.
See more indices live prices
Prices above are subject to our website terms and agreements. Prices are indicative only. All shares prices are delayed by at least 20 mins.
