Support and resistance: what is it and how to identify it
Support and resistance levels can help traders gain extra insight into the strength of a price trend. Here we define support and resistance levels, explain how to identify and draw both lines, and more.


What is support and resistance?
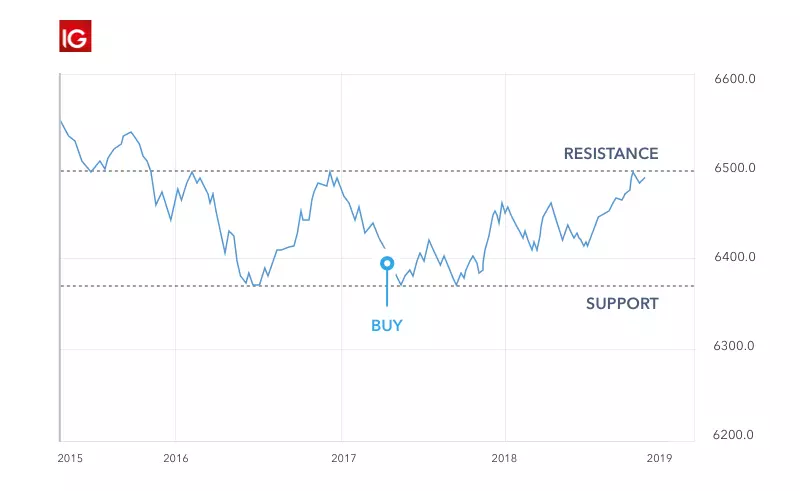
Support and resistance are levels used in trading to identify where a chart might pause or reverse its movement from a point consistently reached by the markets. A support level is where the price repeatedly stops falling and bounces back up, whereas a resistance level is where the price frequently stops rising and dips back down.
The levels are a product of supply and demand – if there are more buyers than sellers, the market will rise, whereas if there are more sellers, the market will fall.
The more often a price hits either level, the more reliable that level is likely to be in predicting future price movements. It often happens that both levels become psychological barriers for traders, as they tend to buy or sell once a level is reached. This only strengthens the levels.
If a price touches or breaks through a support or resistance level but jumps back fairly quickly, it’s only testing that level. But if a price breaks through any given level for a longer period of time, it’s likely to keep rising or falling until a new support or resistance level is established.
When a price does break through, the previous support or resistance level can reverse and become its opposite – say, if price breaks a resistance level, it’s possible that it will then become a support level.
How to identify support and resistance level
There are several ways to spot support and resistance levels, helping you choose the best time to enter the market and where to place your stops and limits.
Here are a few ways you can look at:
1. Historical price data
The most reliable source for identifying support and resistance levels is historical prices, making them invaluable to traders. The key is to familiarise yourself with past patterns – sometimes from very recent activity – so you can recognise them if they appear again. However, it’s important to remember that past patterns may have formed under different circumstances, so they’re not always a reliable indicator.
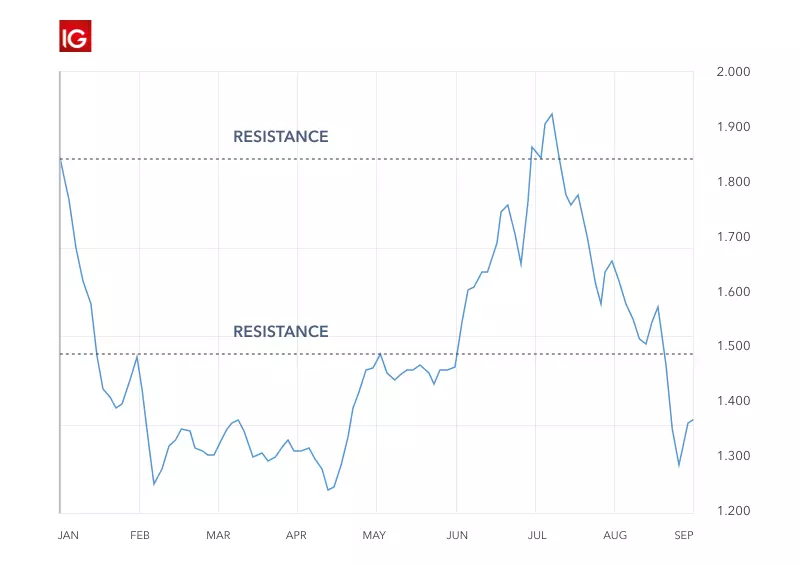
2. Previous support and resistance levels
You can use previous notable support or resistance levels as markers for possible entry and exit points, as well as indicators of future movement. It's important to note that major support and resistance levels are rarely exact figures. It's unusual for a market to hit exactly the same price time after time before reversing, so it's probably more useful to think of them as support or resistance zones.
3. Round numbers
New traders tend to prefer round numbers because they’re easier to work with. Investment banks also like them when setting target prices and stop orders. So, because so many orders are placed at round number levels, you’ll often find support and resistance levels at them.
4. Sideways trends
Support and resistance levels can be close enough that they form a sideways trend – without showing a clear direction.
Traders can try to find trades within these levels, taking short positions as the price touches the upper trendline and long positions as the price touches the lower trendline.
This is a particularly risky strategy, so if you want to trade this way, make sure strong risk management practices are in place.
5. Technical indicators
Technical indicators – such as moving averages covered later in this article – or trend lines can provide dynamic support or resistance levels that move as the chart progresses. Support and resistance levels for different markets will often be based on diverse factors, so developing the ability to recognise which levels are going to impact a market’s price can take time. For that reason, it’s important to practise identifying support and resistance levels using historical charts.
How to draw support and resistance lines
There are several ways to identify and draw support and resistance lines on a chart. Here are four ways to do it (and remember, you can combine them):
1. Peaks and troughs
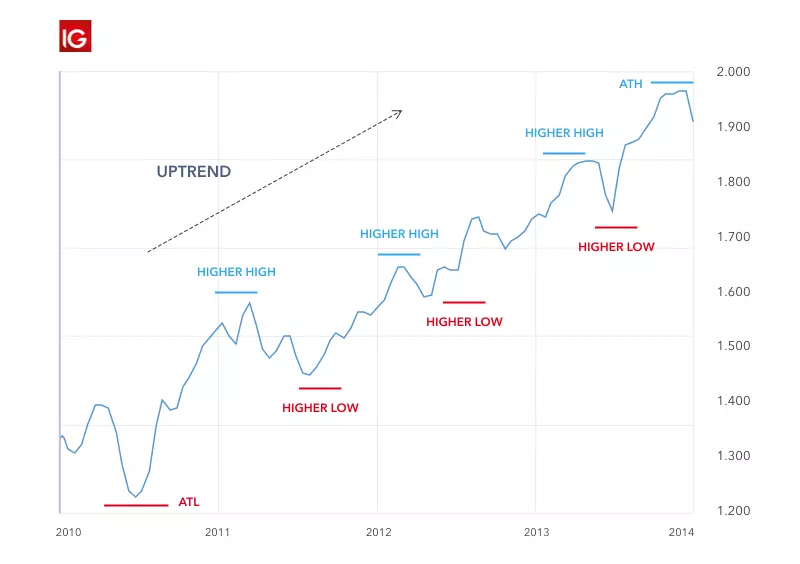
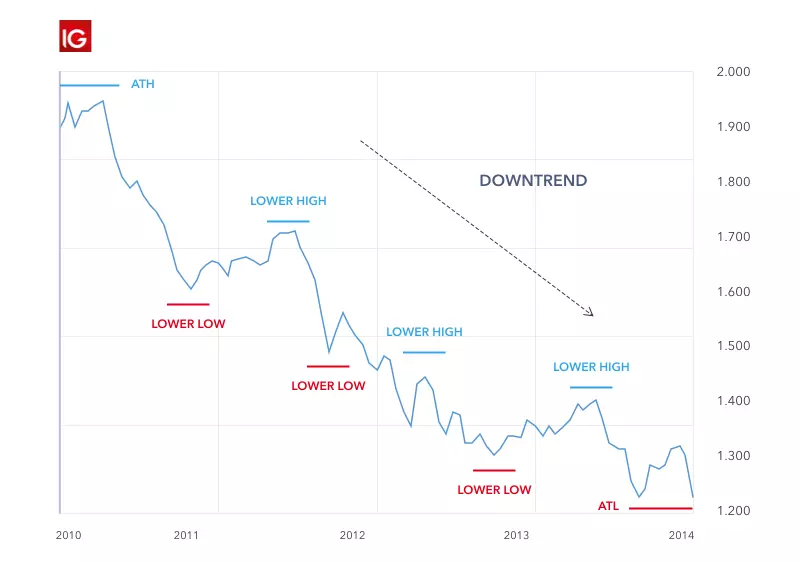
To draw your lines using peaks and troughs, select your time frame, then identify the highest peak on the chart and do the same with the lowest point. Mark each peak and trough. If there is a downtrend, the support level will be the lower-low peak and the resistance level will be the lower-high peak. Conversely, if there is an upward trend the support level will be the higher-low peak and the resistance level will be the higher-high peak.
2. Support and resistance levels from a previous time frame
If you’re using support and resistance levels from a previous time frame, choose a short time frame, for example 15 minutes. Then, draw the levels from the one-hour and four-hour time frames on the 15-minute frame. If the levels from the longer time frames are similar or equal to the levels from the shorter time frame, these could be considered strong levels of support and resistance.
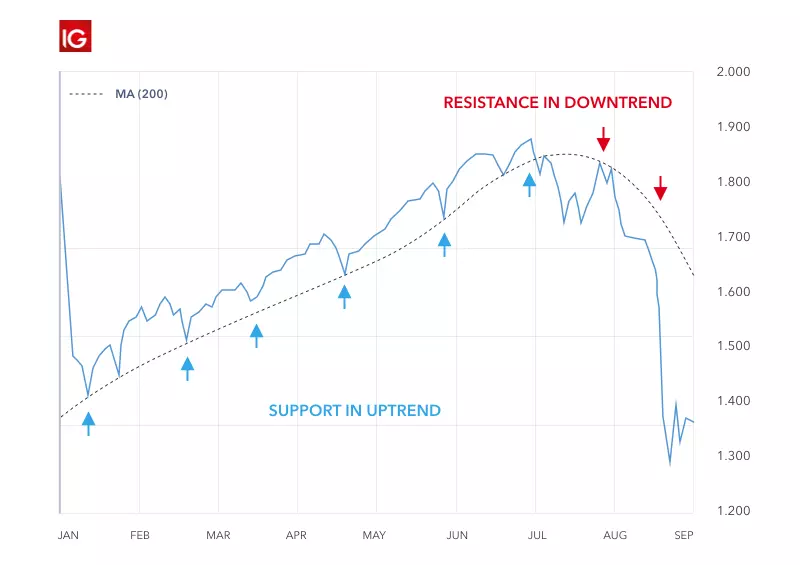
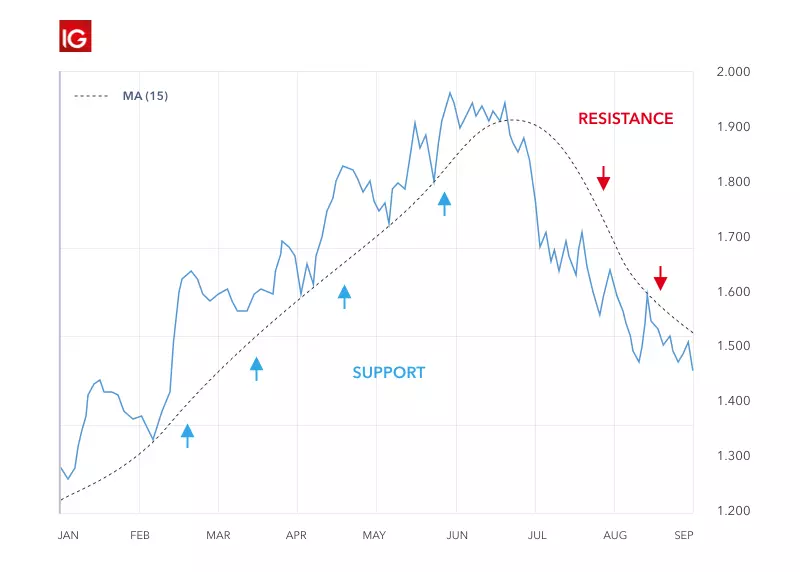
3. Moving averages
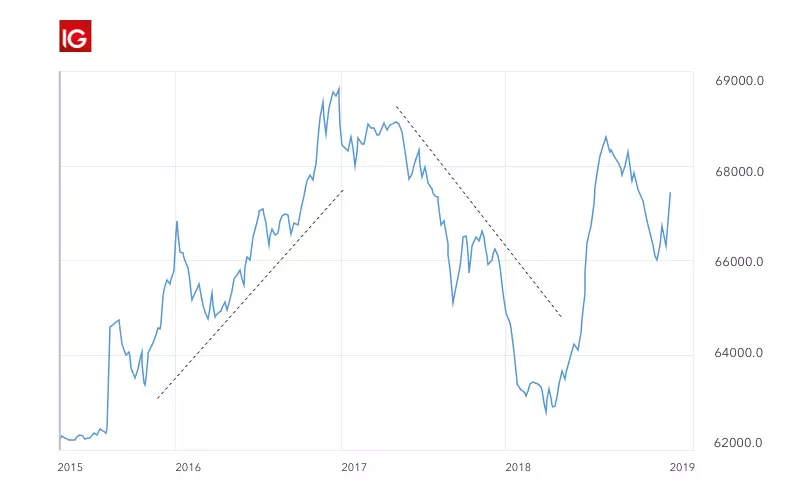
The moving average can be used as a support and resistance indicator and is another way to identify support and resistance levels and draw them on a chart. With the indicator enabled, draw a diagonal line from the highest peak to the lowest peak to see which way the trend is moving. If the trendline moves up, this moving average line will act as a level of support and vice versa. This is called dynamic support or resistance, because the levels are constantly changing.
4. Trendlines
If you’re using trendlines, make sure you have at least three peaks or three troughs before you draw your lines. Then, once you've plotted the trendlines onto your chart, your uptrend line will be the support level, while the downtrend line will be the resistance level. As with moving average support and resistance levels, these levels are dynamic.
Support and resistance trading strategy
Using support and resistance levels as a trading strategy is one of the very basic methods of trading. It can be used to manage risk and place stops, determine the market conditions and find appropriate entry and exit positions.
The most common trading strategy using support and resistance levels is buying (going long) when the price is closing in on the support level and selling (going short) when the price is moving closer to the resistance level. However, traders should wait for some confirmation that the market is still following the trend.
Another strategy used in support and resistance trading is the breakout strategy, whereby traders wait for the stock price to move outside either level. A breakout is not just a slight movement beyond the support or resistance levels. It’s defined by particularly sudden and rapid movement with increased momentum, which creates opportunities for profit. But remember, losses can also occur.
How to start trading support and resistance levels with us
- Create a CFD account with us or log in
- Identify and interpret support and resistance levels on your market of choice
- Click ‘buy’ to go long or ‘sell’ to short on CFDs
- Set your position size
- Take steps to manage your risk
- Open and monitor your position
IGA, may distribute information/research produced by its respective foreign affiliates within the IG Group of companies pursuant to an arrangement under Regulation 32C of the Financial Advisers Regulations. Where the research is distributed in Singapore to a person who is not an Accredited Investor, Expert Investor or an Institutional Investor, IGA accepts legal responsibility for the contents of the report to such persons only to the extent required by law. Singapore recipients should contact IGA at 6390 5118 for matters arising from, or in connection with the information distributed.
The information/research herein is prepared by IG Asia Pte Ltd (IGA) and its foreign affiliated companies (collectively known as the IG Group) and is intended for general circulation only. It does not take into account the specific investment objectives, financial situation, or particular needs of any particular person. You should take into account your specific investment objectives, financial situation, and particular needs before making a commitment to trade, including seeking advice from an independent financial adviser regarding the suitability of the investment, under a separate engagement, as you deem fit.
Please see important Research Disclaimer.

Explore the markets with our free course
Discover the range of markets you can trade on - and learn how they work - with IG Academy's online course.
