Skip to content

CFDs are complex instruments and come with a high risk of losing money rapidly due to leverage. Please ensure you fully understand the risks involved. CFDs are complex instruments and come with a high risk of losing money rapidly due to leverage. Please ensure you fully understand the risks involved.

Platform help and support

Watch our video guides and browse our FAQs for answers to your IG Trading platform questions.

Video guides

Video poster image

Dashboard walkthrough

Learn how to navigate your home dashboard, add additional trading accounts, rename your accounts, access the live trading
platform and more.

Video poster image

Live account

Discover where to add funds to your trading accounts, withdraw funds back to your card or bank, and transfer funds
between your accounts.

Video poster image

Demo account

Find out how to add virtual funds to your demo account so you can get a feel for trading the markets without having to put
any real money at risk.

Video poster image

Settings

In this video you’ll learn how to update your personal details, as well as enable/disable data feeds, pricing alerts, dealing alerts
and rollovers.

Video poster image

Inbox, community, and academy

Find out how to view your inbox, access IG Community and IG Academy, as well as get answers to common questions on our Help & Support pages.

Video poster image

Workspace

Discover how to set up workspaces and customise them, plus how to find specific tickers, filter through asset classes and keep an eye on open positions.

Video poster image

Charts

Learn the basics of how charts work, plus how to add technical indicators and manage split charts to view different
timeframes at once.

Video poster image

Charting: drawing, layout, and technical indicators

In this video we dive a little further into adding and customising technical indicators like RSI and Bollinger Bands, plus add trend lines
and more.

Video poster image

Trading: alerts and info

Find out how to set up and customise trading alerts, plus how contract size per point can make a big difference to your position size.

Video poster image

Placing a trade

Learn how to place a trade and add/remove stop losses and take profits, plus understand risk to reward ratios and guaranteed vs trailing stop losses.

Video poster image

Placing an order

Discover how to set up an order to be filled if the price hits a level you specify, plus learn the difference between force open
and net off.

FAQs

Getting started

How does the new platform differ from our old platform?

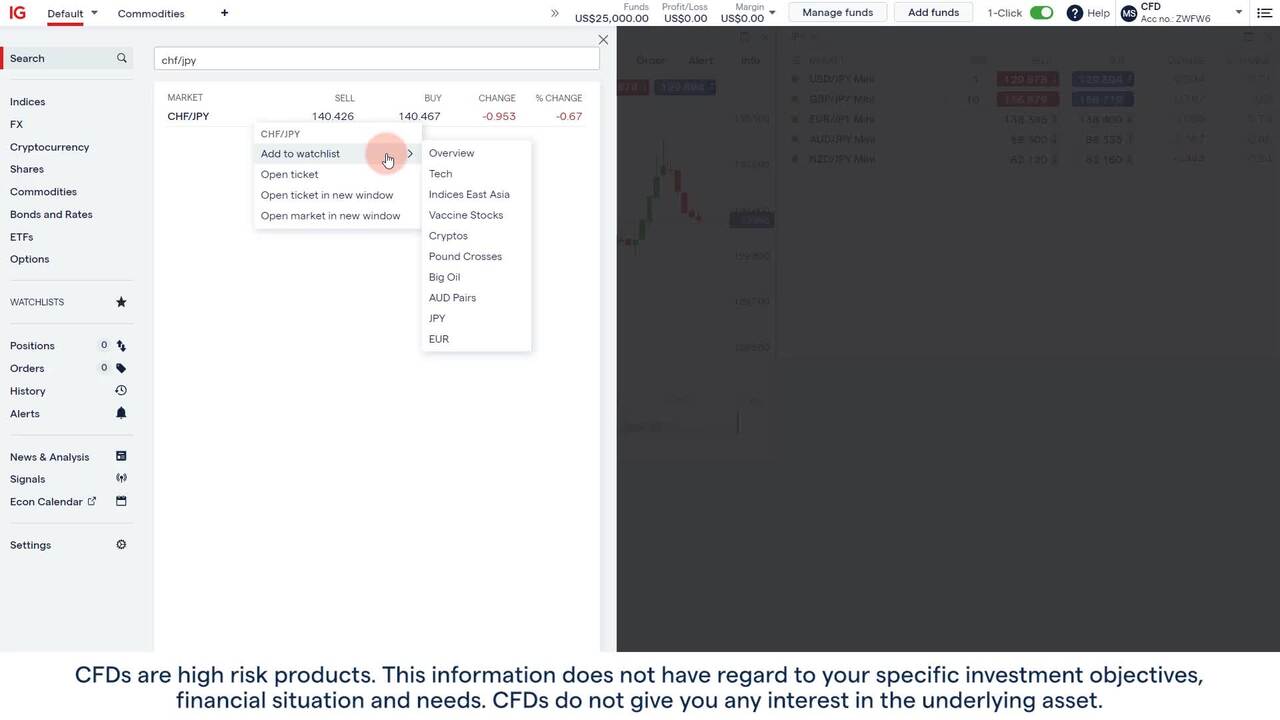
Our new platform is even quicker and more reliable than our classic web platform, with an easier-to-use, more configurable interface. The fly-out menu on the left makes it easier than ever to get to your preferred markets and instruments.

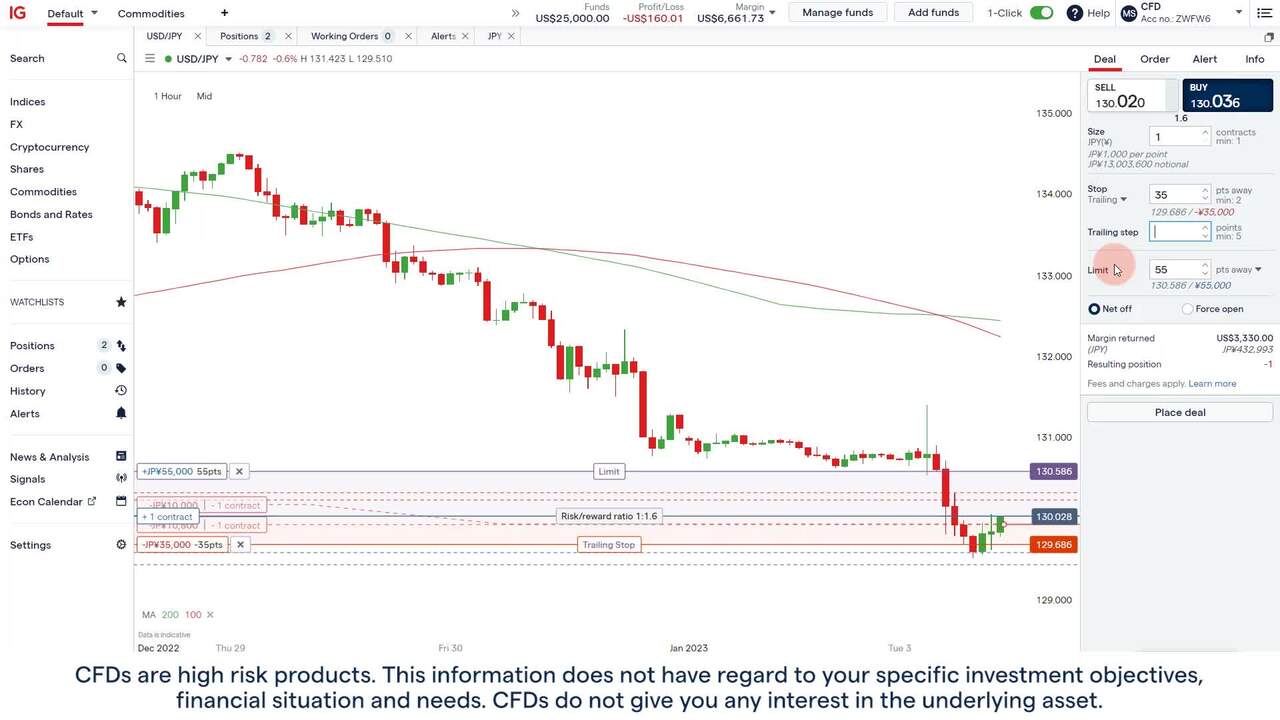
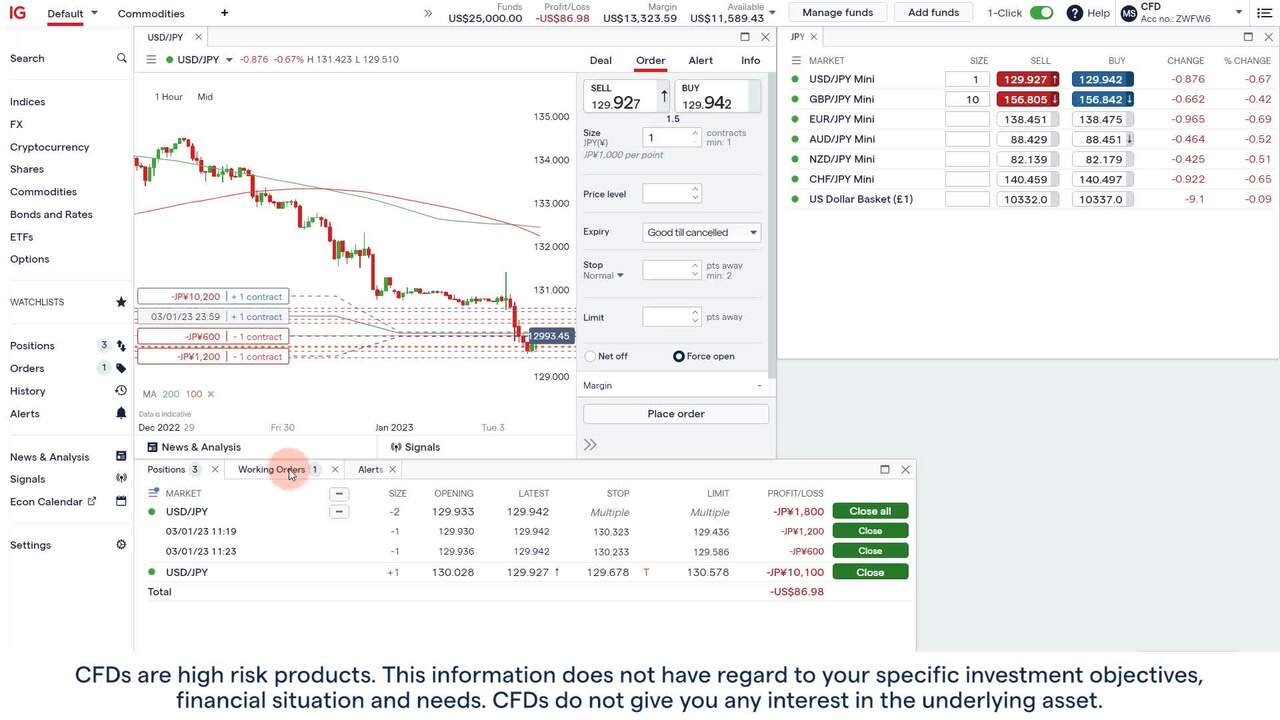
Build advanced custom layouts by adding markets, positions, watchlists and more from the fly-out menu to your workspace. We'll automatically save your workspaces when you log out, so you can pick up where you left off.

We’ve ordered shares by popularity and market movement, allowing you to quickly see and trade on new opportunities.

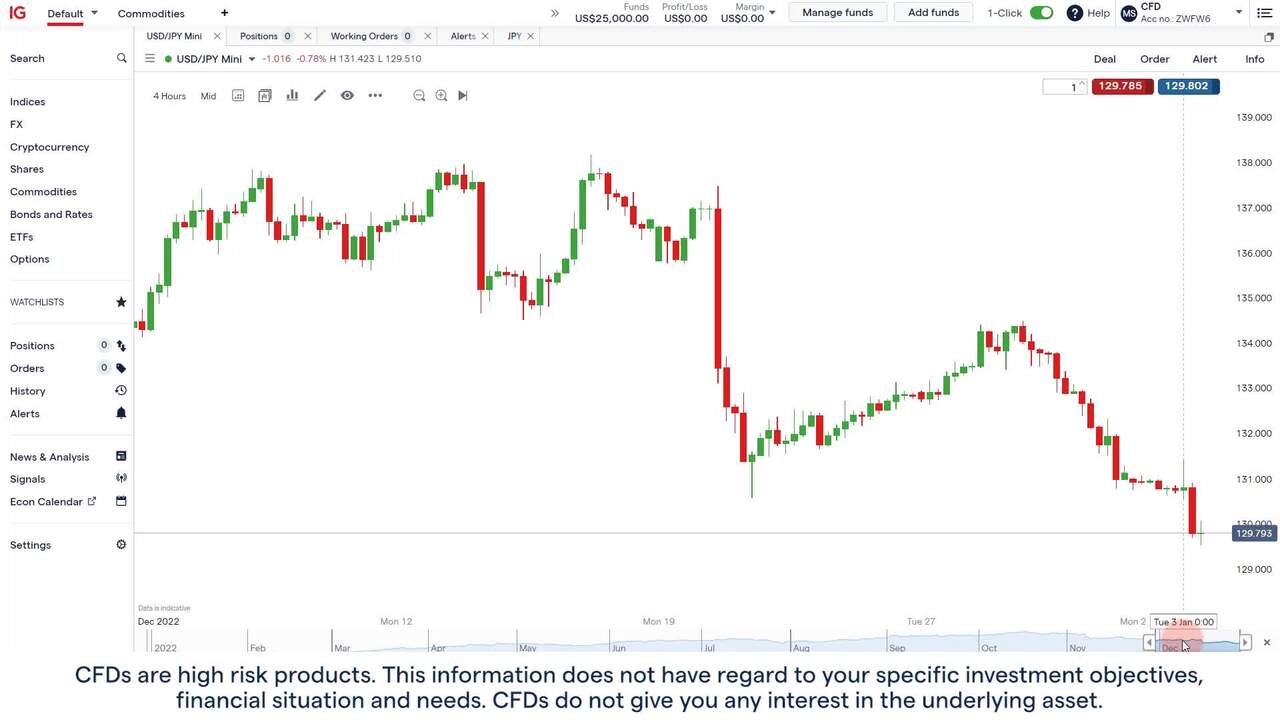
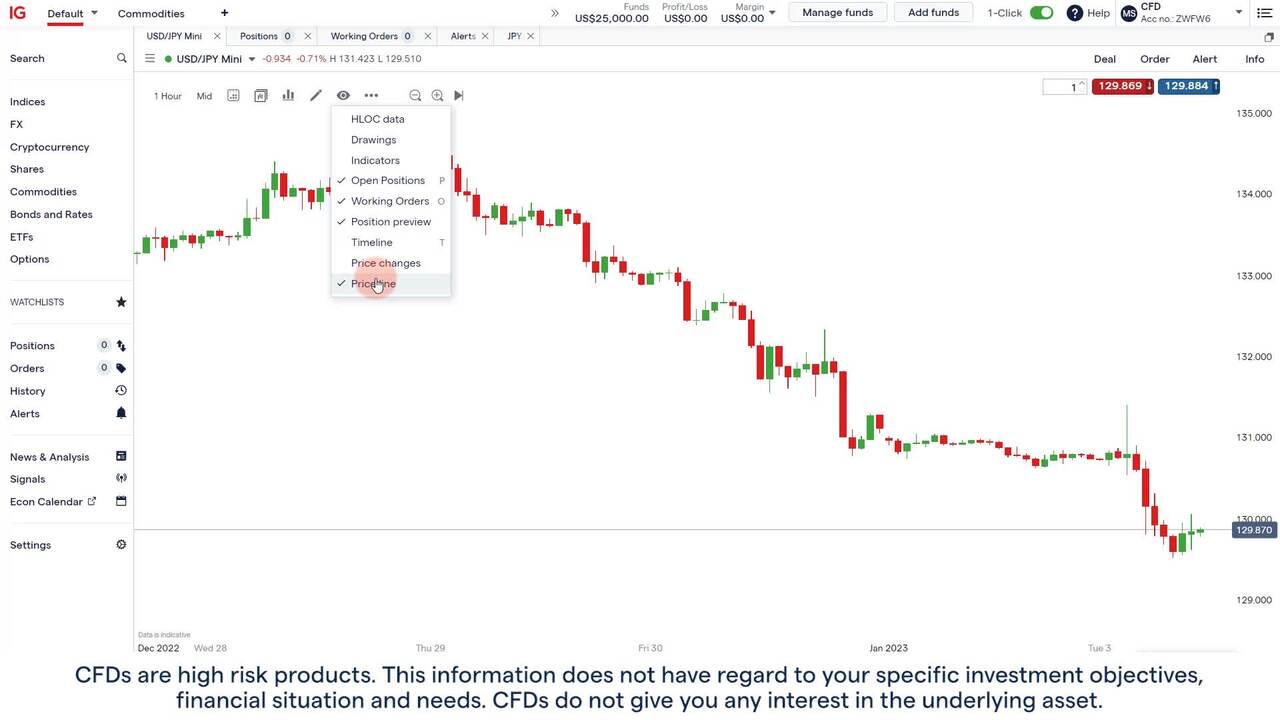
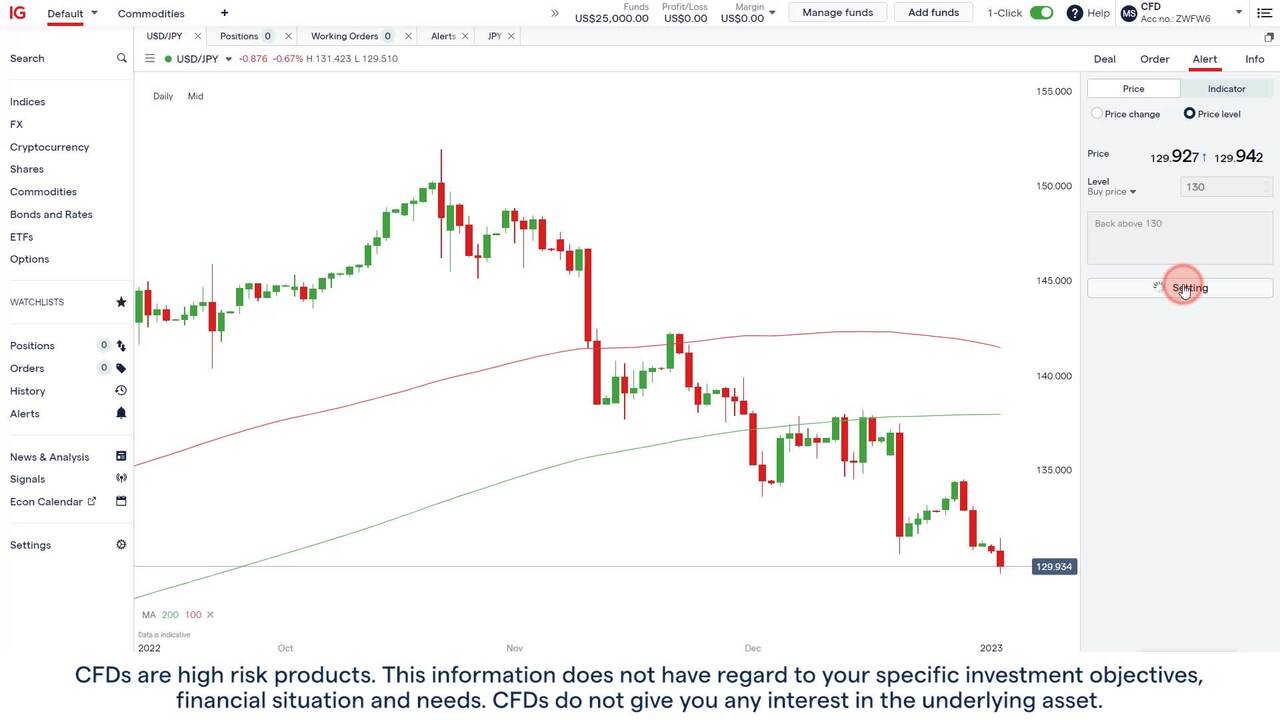
We’ve also used the latest HTML5 technology to ensure our new platform delivers our quickest and most stable charting experience ever. 

To see the various other ways in which the new platform is different, browse our collection of guides on this page.

You’ll find almost all of our available markets on the new platform already. Options, along with equities that trade on exchanges outside the UK, US and Australia, will be coming soon.

Where can I find my watchlists, working orders and open positions?

You’ll find them all under the ‘watchlists’, ‘orders’ and ‘positions’ tabs in the left-hand menu. Add them to your workspace by clicking the ‘add to workspace’ button, and they’ll be there each time you log in. By default, ‘positions’ will be on your workspace when you first log in.

How do I use the platform with a demo account?

Go to the dashboard in My IG and select the ‘Open platform’ button next to your demo account. Using your demo account is a great way to explore the platform at your own pace, without any risk.

If you don’t have a demo CFD trading account already set up, it only takes a moment to add one in My IG. Just go to the ‘demo accounts’ tab and select ‘create demo account’.

You’ll have A$20,000 of virtual money to practise with, as well as an opportunity to explore our platform.

How do I provide feedback?

You can share your thoughts via our client forum, IG Community. Simply log in – or take a moment to register as a member – and discuss your experiences with other traders.

Charts

How do I add drawings and indicators to a chart?

You can add drawings and indicators by right-clicking on the chart and selecting them from the menu, or clicking the drawings and indicators icons at the top of the chart.

How do I customise charts?

To alter the style of your chart, right-click the chart and go to ‘types’. You can choose between candlestick, line, HLOC and mountain.

You can also change the format and colours of your chart by going to ‘customise appearance’ in the right-click menu.

How do I customise technical indicators?

When you add a technical indicator to a chart, its current parameters appear in either the lower left corner, or the top left corner.

Click on these parameters to bring up a panel, where you can edit the figures to suit your preferences, or reset them to their defaults. From here, you can also change the style and colour of your indicators.

How do I show news events and economic information in-chart?

Right-click on a chart and go to ‘events’, where you’ll find a range of different regions and event types.

Once you’ve selected which events you want to show, calendar icons appear along the bottom of the chart marking past and future release dates. Click on these icons to view the event’s previous, estimated and, if available, actual figures.

How do I edit stops and limits on a chart?

Select an open position on the chart by clicking the position summary box on the left. Drag your stop or limit from the stop/limit box to your desired level and release to submit your amendment. You can also double-click the position summary box and enter a stop or limit as a level.

How do I view market data on a chart?

To view a market’s high, low, open and close, right-click on a chart, click ‘show’ and then ‘data’. The data displayed reflects your chosen timeframe.

The ‘price changes’ data in the bottom left of a chart summarises the chart as a whole. You can amend the time period you see using the ‘timeline’ bar.

Display the ‘timeline’ bar by right-clicking on the chart, then selecting ‘show’ and ‘timeline’. You can now amend the time period with your cursor, and each time you do, the data at the bottom of the
chart updates automatically.

Trading

How do I place a trade?

By default, there are three ways you can place a trade on a market with our platform.

Option 1
With markets in watchlists, simply click the ‘Buy’ or ‘Sell’ buttons to open a panel which allows you to enter a size and place the trade. To apply stop and/or limit distances to your position after creating it, just go to the Positions tab and add from there.

Option 2
To access more settings when placing your trade, you can use the deal ticket. Click on the name of a market to show its chart and deal ticket side by side. If the deal ticket is hidden, you can reveal it by clicking on the ‘Deal’ button in the top-right corner of the chart.

Once you’ve selected your market direction (buy/sell) and entered a size, the ‘Place deal’ button will light up green, meaning you’re ready to place your deal. Don’t forget to set your desired stop and limit distances.

Option 3
It’s also possible to trade straight from a chart or watchlist with the ‘1-Click’ dealing feature. Enable 1-click dealing from the toggle in the top navigation bar, and we’ll remember your trade settings. Enter a size and click ‘Buy’ or ‘Sell’ to immediately open a position, and click ‘Close’ to immediately close a position.

How do I place an order?

To plan a trade for when a market reaches a certain level, you can use the Order ticket.

When you click on the name of a market, its chart and deal ticket will appear side by side. To reveal the order ticket, click Order.

Choose your direction (buy/sell), size, price level and expiry time, and click the ‘Place order’ button when it lights up green.

You’ll receive a notification once you’ve placed the order, and another if the position is opened.

How do I change contract size (point value)?

First, open a market from the menu on the left or by using the search tool in the top left-hand corner. Choose your trade direction or click ‘Deal’, then choose a point value (or contract size), and add your desired stop and limit distances.

We'll display your chosen contract size below the ‘size’ field in the deal and order tickets.

How can I use guaranteed or trailing stops?

You can use guaranteed or trailing stops when placing a trade or order.

Click the drop-down menu below ‘Stop’ in the ticket to choose a between a normal, guaranteed or trailing stop.

If you select a trailing stop, we'll give you the option to set a trailing step.

Please note that guaranteed stops cannot be moved closer when the market is closed, and certain markets can't be traded with a guaranteed stop. If the option doesn't appear in the drop-down menu, it might not be possible in that market.

Where can I see the required margin to open a position?

You’ll find key trading information, such as the margin required for a trade and your available balance, at the bottom of every deal ticket.

We use the trade direction and size when calculating margin, so you'll need to select a direction and position size before being able to see the required margin.

How do trade settings work?

Simply click on ‘settings’ on the menu and check the options that suit you. You can make the platform:

  • Remember your last size or stop distance, per market
  • Control how we execute opposing positions on the same market. By default, this is set to netting off, but you can change your default setting to force open
  • Accept partial fills, points through current and market orders

You can also choose to change and save price and fill settings on the deal ticket.

If you use a different browser or computer, you may need to refresh for any changes in settings made elsewhere to take effect, but you shouldn't need to re-enter them from scratch.

How do I set a position to force open?

Force open allows you to hold multiple positions in opposite directions on the same market simultaneously. If you don’t select ‘force open’, opposing positions will by default ‘net off’ (our recommended option), which may close your original position.

To enable the force open option, go to the ‘Settings’ menu and turn on ‘Show force open in ticket’. You’ll then be able to specify if you’d like a position to force open at the point of confirming the trade. You can also choose to make ‘force open’ your default.

How do I view a deal ticket without a chart?

There are multiple ways to view a deal ticket without the chart.

If you have the chart open, click the menu at the top left of the chart (beside the market name) and select ‘Open ticket in new window’.

You can also view a ticket on its own by minimising a chart on the workspace. With the deal ticket open, click and drag the edge of the chart. You'll be able to minimise it to the point of closing the chart altogether, leaving a deal ticket-only view. To reveal the chart again, simply expand it by clicking and dragging the edges again.

Finally, you can right-click a market in a list and select ‘Open ticket in new window’.

How do I edit my positions?

There are numerous ways you can edit trade and orders once they have been placed.
 
You can edit positions from the ‘positions’ and ‘working orders’ panels on your workspace (if they’re not on your workspace, you can add them from the ‘positions’ and ‘orders’ tabs in the fly-out menu, on the left side of the screen). Add or edit stops and limits by clicking the values in the table. With orders, you can edit the entry level by clicking the value as well. 
 
You can also add stops and limits to positions directly on the chart clicking on the position and dragging upwards or downwards. We'll give you a risk/reward ratio based on your chosen stop and limit.
 
Please note that you can't edit an existing position or order using a deal or order ticket. Entering new data here and clicking ‘place deal’ or ‘place order’ will result in a new position being created.

How do I close an open position?

You can view all your open positions from the ‘Positions’ panel on your workspace. If it’s not on your workspace, you can add it by clicking on ‘Positions’ in the left-hand menu.

By clicking ‘Close’ next to the position you want to close out, or ‘Close all’ next to multiple positions in the same market, you’ll confirm your potential profit or loss, and see the amount in contracts required to close your position. You can also change the number of contracts to partially close the position.

Click on the ‘Buy’ or ‘Sell’ button that appears, and you’ll receive a notification confirming your position is now closed.

It's also possible to close a position directly from a chart. Simply click the position, and click the ‘Close’ button that appears.

Where can I find..?

Where can I find options?

Options are currently unavailable in the new platform, but we’ll be adding them soon.

In the meantime, all our options are available as normal on our mobile app, and on our classic web platform.

Where can I find alerts?

You can find alerts on the ‘Alert’ tab at the top right of a chart (beside the ‘Deal’ and ‘Order’ tabs). Here you’ll be able to set price change alerts to trigger on proportional market movement, and price level alerts to trigger when the price reaches a certain level.

You can view and edit your active alerts from the ‘Alerts’ tab in the left-hand menu.

Where can I find sprint markets?

Please note, we will not be making sprint markets available in the new platform. You can continue to access sprints as normal using our apps or classic web platform.

Where can I find futures?

Find your way to the relevant market using the left-hand menu. For markets which offer both cash and futures/forward trades, we initially list their cash price. This means the price you first see is the closest available to its underlying price.

Click on a market to bring up the chart. If available, you'll see a 'Futures’ dropdown immediately next to the market name. Clicking on this reveals all the available expiries. Select which one you want to trade and add it to a watchlist and/or workspace for quicker access next time.

For markets on your workspace, you can access the available expiries by clicking the market name.

Where can I find my trading history?

To access trades you have recently closed, simply click ‘History’ in the left-hand menu. If you’d like to see older trades, click ‘View full history’ in the top right of this tab.

My IG will open in a new window, where you can specify the time period for which you would like to see your trading history.

How do I get to My IG from the new platform?

To access the My IG dashboard, simply click on the name of your account at the top-right of the navigation bar and select ‘My IG’.

You’ll need to go to My IG to fund your account, as well as to amend your details and view your trade history.

How do I log out of the new platform?

Click on the account name at the top-right of the navigation bar and select ‘Logout’. All your settings and workspaces are automatically saved, so they’ll be exactly as you left them when you come back later.

How do I launch ProRealTime?

To launch ProRealTime, you first need to activate it:

  1. Log in to My IG
  2. Head to Settings > Trade Settings and select ‘ProRealTime’
  3. Take a moment to read our client agreement and costs details
  4. Click ‘activate ProRealTime for live accounts’

You can now launch ProRealTime via the platform: simply click the menu at the top left of a chart (beside the market name) – or right-click on a market in a list – and select ‘open in ProRealTime’ in the dropdown.

You can also launch ProRealTime from the dropdown menu under your account name, in the top-right of the navigation bar, or via My IG by left-clicking the drop down icon next to 'open platform'.

Customisation

How do I add a chart or list to my layout (workspace)?

Click on the market or watchlist, and in the top right of the chart, select 'Add to workspace'.

How do I tear off charts and tickets into a new window?

Click the menu at the top left of a chart, beside the market name – or right-click on a market in a list – and select ‘Open in new window’ in the dropdown.

How do I hide the Twitter and notifications feed?

Click the ‘Notifications’ icon in the extreme top right-hand corner of the platform to toggle the feed on and off.

How do I switch between light and dark platform themes?

Go to ‘Settings’ in the left-hand menu and choose your preferred theme under Platform settings’.

How do I create a watchlist?

Select ‘Watchlists’ from the left-hand menu. Click the ‘Create watchlist’ button, type in a name and hit enter. You can then right-click on any market name to add it to your new watchlist.

How do I reorder a watchlist?

To reorder a watchlist, simply drag and drop markets into an order of your choosing.

How do I create a new layout (workspace)?

You’ll see your first workspace as soon as you first log in to the platform, but you can add as many new ones as you like, helping you to prepare for specific events and markets.

To add a new workspace, click on the plus sign next to existing workspaces at the very top of the platform. Add watchlists, markets, open positions, working orders and other panels to your new workspace by clicking the relevant ‘Add to workspace’ button.

How do I save a layout (workspace)?

You won’t need to as the platform automatically remembers any modifications to your layouts and settings, and saves them for next time.

Create an account in minutes and start trading straight away

Can’t find what you’re looking for? Visit IG Community, our dedicated client forum.