Wall Street update: Nasdaq strikes a new high led by Meta
US stock markets experienced gains last week, driven by tech stocks and delays in new tariffs, while retail sales data and Federal Reserve updates remain in focus.


Tech stocks and tariff delays boost US markets
United States (US) stock markets rose last week, led by gains in tech stocks, delays in new US tariffs, and aspects within the producer price index that eased inflation jitters. For the week, the Nasdaq 100 surged by 2.9%, the S&P 500 increased by 1.43%, and Dow Jones gained 0.55%.
Retail sales decline impacts GDP estimates
The upside momentum faltered on Friday night following a surprise 0.9% drop in headline retail sales for January - the largest fall in a year. The all-important retail control group, which feeds through into gross domestic product (GDP) calculations, fell by 0.8%, missing expectations of a 0.3% increase.
The decline may result from some payback after solid spending during the holiday period and severe weather conditions, including wildfires and unusually cold weather. Following the data release, the Atlanta Federal Reserve's (Fed) GDPNow estimate of first quarter (Q1) 2024 GDP growth fell to 2.3%, down from 2.9% in its previous estimate on 7 February.
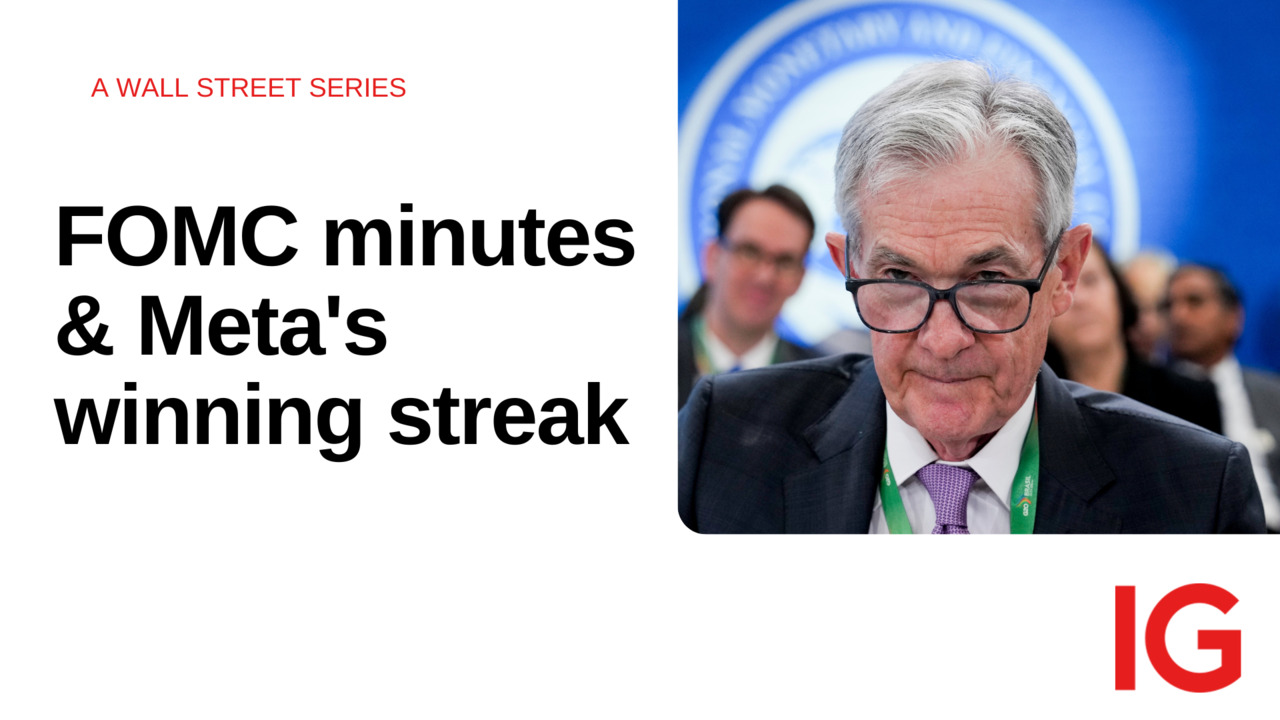
Focus on the Fed and earnings reports
Looking ahead, investor attention this week will focus on the Federal Open Market Committee (FOMC) minutes previewed below, speeches by several Fed officials, and whether Meta can extend its run of twenty consecutive up days.
Meanwhile, the US fourth quarter (Q4) 2024 earnings season rolls on with reports set to drop from companies such as TripAdvisor, Dropbox, Rivian, Walmart, and Alibaba, whose share price has rallied 47% year to date (YTD), boosted by optimism around its artificial intelligence (AI) service and platform and a tie-up with Apple announced last week.
Federal Open Market Committee minutes preview
Date: Thursday, 20 February at 6.00am AEDT
At its meeting in late January, the Fed kept the Fed Funds target interest rate unchanged at 4.25% - 4.50%, as widely expected.
Fed Chair Powell noted that while the policy rate was 'meaningfully restrictive' growth remained steady, and the labour market was stable. Fed Chair Powell said the Fed is in no hurry to cut rates again and omitted previous mentions of progress on reducing inflation.
The minutes will be scanned for more details about the FOMC's views of appropriate policy settings and any clues of policy guidance going forward. The US rates market starts the week pricing in 40 basis points (bp) of Fed rate cuts for 2025.
Federal funds rate chart

Nasdaq 100 technical analysis
After trading sideways for eight weeks as part of a correction from the 22,133-record high of mid-December, the Nasdaq 100 hit a fresh record high at the end of last week. As we have noted previously a sustained break above resistance at 22,000 - 22,200 would confirm that the correction is complete and that the uptrend has resumed, targeting a move towards 23,000.
Conversely, while the Nasdaq 100 remains below the 22,000 - 22,200 resistance level, further evidence is required, and it leaves the correction open to another leg lower towards 20,500 with scope into the 20,000 - 19,800 critical support region.
Nasdaq 100 cash daily chart

S&P 500 technical analysis
Since striking a higher of 6128 in late January, the S&P 500 has been tracing out a correction between 6120 and 5920.
A sustained break above resistance at 6120 - 6130 would confirm the correction is complete and the uptrend has resumed, targeting a move to 6350.
Conversely, while the S&P 500 remains below the 6120 - 6130 resistance zone it leaves the correction open to another leg lower towards uptrend support at 5820 - 5773 coming from the mid-January low and uptrend support from the October 2023 4103 low.
If the S&P 500 saw a sustained break of the 5800 - 5770 support zone, it would warn that a deeper decline is underway towards the 200-day moving average at 5655.
S&P 500 cash daily chart

- Source: TradingView. The figures stated are as of 17 February 2025. Past performance is not a reliable indicator of future performance. This report does not contain and is not to be taken as containing any financial product advice or financial product recommendation.
This information has been prepared by IG, a trading name of IG Australia Pty Ltd. In addition to the disclaimer below, the material on this page does not contain a record of our trading prices, or an offer of, or solicitation for, a transaction in any financial instrument. IG accepts no responsibility for any use that may be made of these comments and for any consequences that result. No representation or warranty is given as to the accuracy or completeness of this information. Consequently any person acting on it does so entirely at their own risk. Any research provided does not have regard to the specific investment objectives, financial situation and needs of any specific person who may receive it. It has not been prepared in accordance with legal requirements designed to promote the independence of investment research and as such is considered to be a marketing communication. Although we are not specifically constrained from dealing ahead of our recommendations we do not seek to take advantage of them before they are provided to our clients.

Take a position on indices
Deal on the world’s major stock indices today.
- Trade the lowest Wall Street spreads on the market
- 1-point spread on the FTSE 100 and Germany 40
- The only provider to offer 24-hour pricing
Live prices on most popular markets
- Forex
- Shares
- Indices