Asia Day Ahead: Nikkei attempts to stabilise, HSI seasonality on watch
Overnight, US Treasury yields reacted to the upside on another hotter-than-expected inflation print, this time from the US producer price index (PPI).


Asia Open
The Asian session looks set for a negative open to end the week, with Nikkei -0.66%, ASX -1.39% and KOSPI -1.12% at the time of writing. Overnight, US Treasury yields reacted to the upside on another hotter-than-expected inflation print, this time from the US producer price index (PPI). Along with a surging US dollar (+0.6%) and the subdued session in Wall Street, risk sentiments across the region are kept on the backfoot.
On the radar, China’s new home prices extended its decline to -1.4% in February, significantly deeper than the -0.7% in January, which suggests that its property downturn remains in place amid sluggish demand. The Hang Seng Properties Index is down more than 1% lower at the time of writing. The People's Bank of China (PBOC) has also kept the rate on its one-year medium-term lending facility rate unchanged at 2.5% in today’s session in a widely-expected move, which is in line with authorities’ current stance for a more gradual approach in extending support.
The China A50 index is back to retest its key 200-day moving average (MA), following an upward break last week, which will have to see some immediate defending from buyers in today’s session. The Hang Seng Index (HSI) dipped 1.3% lower at the time of writing, but that will leave one to watch for any formation of a new higher low to keep the upward trend since January this year in place.
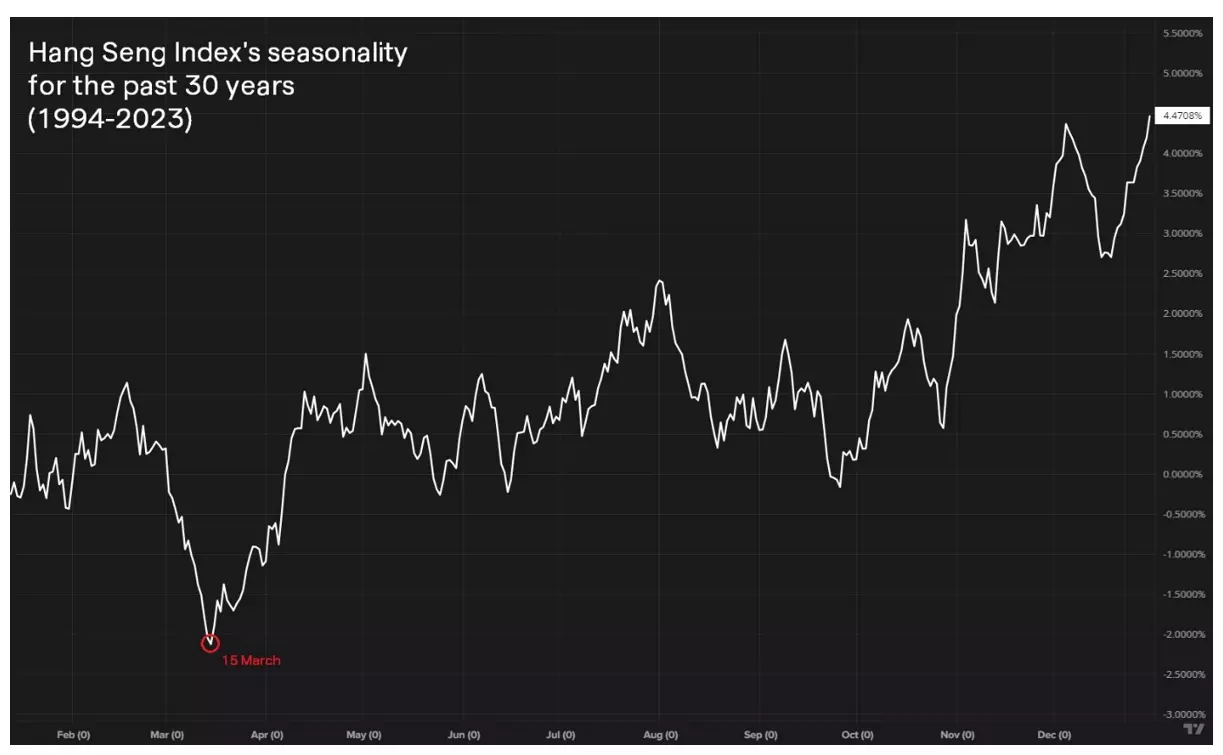
Is the HSI set for better days ahead?
As we officially step into the second half of March today, the HSI is up 1.5% month-to-date and if the bulls want to find further validation, they will be glad to know that seasonality may be in their favour ahead. Looking at the seasonality for the HSI over the past 30 years, the second half of March through the month of April tends to be a turnaround period for the index and is generally supportive of gains.
Of course, one may note that seasonality is essentially an average and is often just used as a pure reference. It did not play out last year, where the index was down 13% from late-March to end-April. To sustain the rebound, economic recovery may remain the key and with recent data revealing some green shoots in China's economy, further follow-through will be much needed ahead.
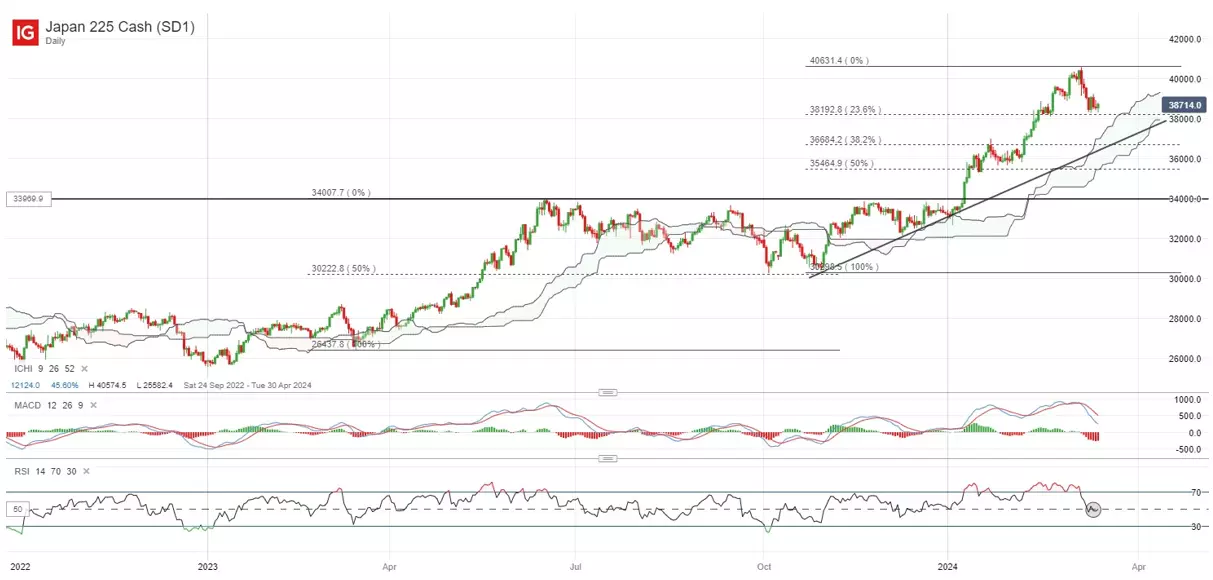
On the watchlist: Nikkei’s daily RSI back to retest its key 50 level
The Nikkei 225 has come under some heavy profit-taking lately, as speculations mount for a quicker stimulus exit from the Bank of Japan (BoJ), which may drive a cautious lead-up to the BoJ meeting next week.
The index has dipped more than 5% to hang around its two-week low, although one may note that it is still up more than 16% year-to-date. For now, its daily relative strength index (RSI) is back to retest its key 50 level for the first time since January this year, which may have to see some defending from buyers.
Ahead, immediate support to watch may potentially be at the 38,200 level, where a 23.6% Fibonacci retracement level stands. The broader upward trend may remain intact for now, with the index still trading above its daily Ichimoku cloud support, along with various moving averages (50-day, 100-day, 200-day).
This information has been prepared by IG, a trading name of IG Markets Limited. In addition to the disclaimer below, the material on this page does not contain a record of our trading prices, or an offer of, or solicitation for, a transaction in any financial instrument. IG accepts no responsibility for any use that may be made of these comments and for any consequences that result. No representation or warranty is given as to the accuracy or completeness of this information. Consequently any person acting on it does so entirely at their own risk. Any research provided does not have regard to the specific investment objectives, financial situation and needs of any specific person who may receive it. It has not been prepared in accordance with legal requirements designed to promote the independence of investment research and as such is considered to be a marketing communication. Although we are not specifically constrained from dealing ahead of our recommendations we do not seek to take advantage of them before they are provided to our clients. See full non-independent research disclaimer and quarterly summary.

Act on share opportunities today
Go long or short on thousands of international stocks with spread bets and CFDs.
- Get full exposure for a comparatively small deposit
- Trade on spreads from just 0.1%
- Get greater order book visibility with direct market access
See opportunity on a stock?
Try a risk-free trade in your demo account, and see whether you’re on to something.
- Log in to your demo
- Take your position
- See whether your hunch pays off
See opportunity on a stock?
Don’t miss your chance – upgrade to a live account to take advantage.
- Trade a huge range of popular stocks
- Analyse and deal seamlessly on fast, intuitive charts
- See and react to breaking news in-platform
See opportunity on a stock?
Don’t miss your chance. Log in to take advantage while conditions prevail.
Live prices on most popular markets
- Equities
- Indices
- Forex
- Commodities
Prices above are subject to our website terms and agreements. Prices are indicative only. All share prices are delayed by at least 15 minutes.
Prices above are subject to our website terms and agreements. Prices are indicative only. All shares prices are delayed by at least 15 mins.