Convexity definition
What is bond convexity?
Bond convexity is a measure of the relationship between a bond’s price and interest rates. It is used to assess the impact that a rise or fall in interest rates can have on a bond’s price – which highlights a bond holder’s exposure to risk.
Find out more about bond trading
Learn about the different types of government bonds and how to take a position.
Convexity and duration
To understand convexity, we need to look at what is meant by bond duration – the average time it takes to receive back the cash flows of a bond. It is a useful concept in bond trading because by comparing bond durations, traders may be able to anticipate the degree of price change in a bond after a change in interest rates.
As a rule of thumb, if interest rates increase or decrease by 1%, a bond’s price will decrease or increase 1% for every year of its duration. For example, if a trader had just bought a 10-year bond and interest rates rose by 1%, the bond’s value would likely drop by 10%. If interest rates begin to rise above the return rates of the bond, bond traders may wish to sell.
This is because the bond holder will receive a less attractive rate than they had anticipated when they first bought the bond. In a market with rising interest rates, bond holders look to enter into newly-issued bonds that are giving higher yields.
A change in interest rates can affect the duration of the bond, because an increase in interest rates mean that it would take a longer time for the bond trader to realise a profit. Equally, a drop in interest rates means that it would take a shorter time for a bond trader to realise their full return.
Convexity hopes to correct the disparity between bond prices and interest rates, and it achieves this by accounting for any effect that interest rates can have on the bond’s duration.
Example of bond convexity
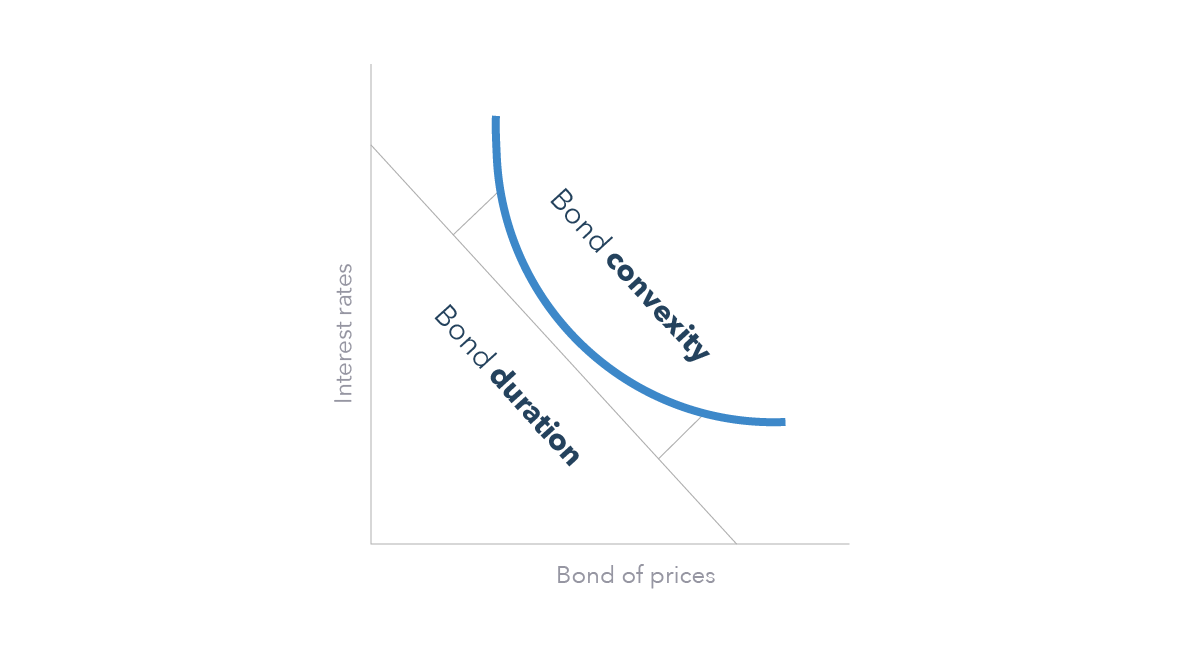
The below graph demonstrates the relationship between bond duration and convexity. The bond’s duration is represented by the straight line plotted between ‘interest rates’ and ‘bond prices’. In contrast, the convexity is the curved line that more accurately predicts any changes in a bond’s price in line with interest rate changes.

Positive and negative convexity
Generally speaking, there are two forms of convexity: positive and negative.
- Positive convexity is when the duration of a bond increases as its price decreases
- Negative convexity is when the duration of a bond increases alongside its price
Traders tend to want positive convexity as it means that bond prices are less sensitive to any changes to interest rates. Negative convexity often works against traders because it means that there will be larger price fluctuations if interest rates rise.
Build your trading knowledge
Discover how to trade with IG Academy, using our series of interactive courses, webinars and seminars.